

Image Source: Unsplash
As part of a new series, each week we typically conduct a DCF on one of the companies in our screens. This week we thought we’d take a look at one of the stocks that is not currently in our screens, Meta Platforms Inc. (META).
Profile
Meta Platforms Inc. is a multinational technology conglomerate focused on social media, virtual reality, and digital advertising. The company operates through multiple key segments:
- Family of Apps (FoA): Includes core businesses such as Facebook, Instagram, Messenger, and WhatsApp.
- Reality Labs: Focuses on virtual reality (VR), augmented reality (AR), and the development of the metaverse.
- Advertising & Commerce: Generates the majority of revenue through digital advertising across its platforms.
Meta continues to expand its AI-driven advertising, content recommendation systems, and virtual/augmented reality ecosystem to drive engagement and monetization.
Recent Performance
Over the past twelve months, Meta’s share price has increased by 23.97%, reflecting strong growth in digital advertising, AI adoption, and strategic investments in the metaverse and reality labs.
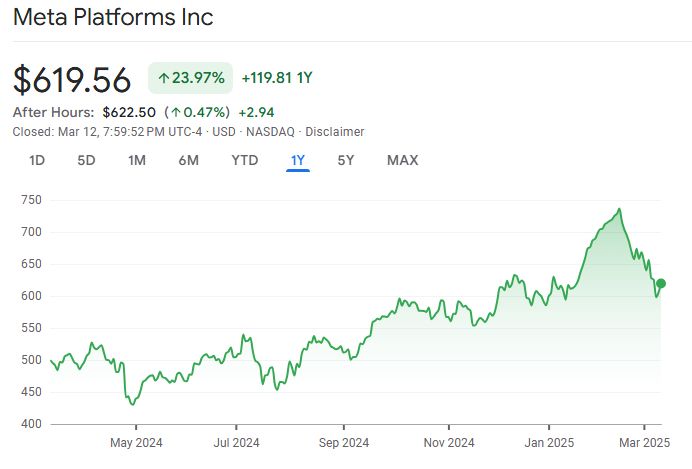
Source: Google Finance
DCF Valuation Inputs
- Discount Rate: 9.5%
- Terminal Growth Rate: 4%
- Weighted Average Cost of Capital (WACC): 9.5%
Forecasted Free Cash Flows (FCFs) in Billions
| Year | FCF ($B) | Present Value ($B) |
|---|---|---|
| 2025 | 50 | 45.7 |
| 2026 | 58 | 48.3 |
| 2027 | 67 | 50.5 |
| 2028 | 77.5 | 52.5 |
| 2029 | 89 | 54.3 |
Total Present Value of FCFs = $251.3 billion
Terminal Value Calculation
Using the perpetuity growth model:
Terminal Value = (FCF in 2029 × (1 + Terminal Growth Rate)) ÷ (Discount Rate – Terminal Growth Rate)
= (89 × 1.04) ÷ (0.095 – 0.04)
= 92.56 ÷ 0.055
= $1,682.91 billion
Present Value of Terminal Value
PV of Terminal Value = Terminal Value ÷ (1 + WACC)^5
= 1,682.91 ÷ (1.095)^5
= 1,682.91 ÷ 1.5703
= $1,071.5 billion
Enterprise Value Calculation
Enterprise Value = Total Present Value of FCFs + PV of Terminal Value
= 251.3 + 1,071.5
= $1,322.8 billion
Net Debt Calculation
As of December 31, 2024:
- Total Debt: $49.06 billion
- Total Cash: $77.81 billion
Net Debt = Total Debt – Total Cash
= 49.06 – 77.81
= – $28.75 billion (Net Cash Position)
Equity Value Calculation
Equity Value = Enterprise Value + Net Cash
= 1,322.8 + 28.75
= $1,351.55 billion
Per-Share DCF Value
- Shares Outstanding: 2.534 billion
Per-Share DCF Value = Equity Value ÷ Shares Outstanding
= 1,351.55 ÷ 2.534
= $533.36
Conclusion
| DCF Value | Current Price | Margin of Safety |
|---|---|---|
| $533.36 | $505.12 | 5.59% |
Based on this DCF valuation, Meta appears slightly undervalued. The estimated intrinsic value of $533.36 per share is higher than the current market price of $505.12, providing a 5.59% margin of safety. This suggests Meta may present a moderate buying opportunity given its strong free cash flow generation, AI-driven ad revenue growth, and investment in future technologies.
More By This Author:
ORCL: One Stock Superinvestors Are Dumping: Is It Time To Sell?
MSFT: One Stock Superinvestors Are Loading Up On
Synchrony Financial: Is This Deeply Undervalued Stock a Hidden Gem?


Comments
Log in or sign up to join the conversation.