Merck & Co Stock Signal: Did Earnings Deliver A Bearish Catalyst?
Short Trade Idea
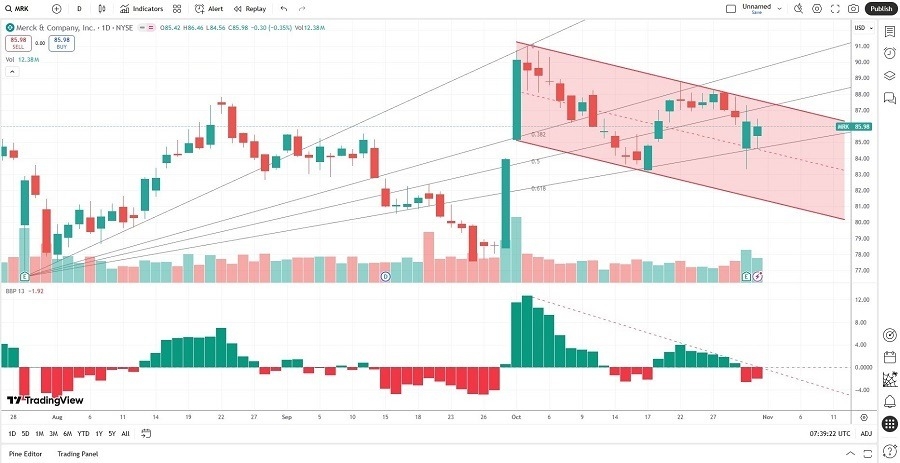
Enter your short position between $83.30 (the intra-day low on its earnings release date) and $86.46 (Friday’s intraday high).
Market Index Analysis
- Merck & Co (MRK) is a member of the Dow Jones Industrial Average, the S&P 100, and the S&P 500 indices.
- All three indices eke out fresh record highs, but bearish volumes have increased over the past four trading sessions.
- The Bull Bear Power Indicator of the S&P 500 is bullish with a rapid descent below its descending trendline.
Market Sentiment Analysis
Equity markets finished last week higher, but bearish volumes have increased. The Federal Reserve lowered interest rates by 25 basis points as expected. Still, Federal Reserve Chairman Powell cautioned that the December outlook remains uncertain and that further interest rate cuts are far from guaranteed amid fresh inflation worries. Optimism about thawing Sino-US relations and hopes that AI names like AMD and Palantir, which lead a busyearnings calendar this week, are driving futures higher in the early morning.
Merck & Co Fundamental Analysis
Merck & Co is a multinational pharmaceutical company. It is a leader in cancer treatments, with vaccines and animal health products rounding out its top three revenue drivers.
So, why am I bearish on MRK after its earnings beat?
Revenues rose to $17.28 billion, and earnings per share clocked in at $2.58. The latter represented a 64% surge year-over-year, and revenues and EPS beat estimates. Still, MRK narrowed its 2025 sales outlook, including a negative 0.5% FX impact and challenges to its core products Gardasil and Keytruda. The former saw sales plunge 25%, while the latter recorded an 8% sales increase. Therefore, I see the good news already priced into the current share price with rising downside risks.
|
Metric |
Value |
Verdict |
|
P/E Ratio |
11.37 |
Bullish |
|
P/B Ratio |
4.56 |
Bearish |
|
PEG Ratio |
0.80 |
Bullish |
|
Current Ratio |
1.42 |
Bearish |
|
ROIC-WACC Ratio |
Positive |
Bullish |
Merck & Co Fundamental Analysis Snapshot
The price-to-earning (P/E) ratio of 11.37 makes MRK an inexpensive stock. By comparison, the P/E ratio for the S&P 500 is 30.74.
The average analyst price target for MRK is $101.76, suggesting good upside potential but higher downside risks.
Merck & Co Technical Analysis
Today’s MRK Signal
(Click on image to enlarge)

- The MRK D1 chart shows price inside a bearish price channel.
- It also shows price action between its ascending 50.0% and 61.8% Fibonacci Retracement Fan levels, following a breakdown.
- The Bull Bear Power Indicator is bearish with a descending trendline.
- The average bearish trading volumes are higher than the average bullish trading volumes.
- MRK corrected as the S&P 500 Index set fresh records, a bearish confirmation.
My Call on Merck & Co
I am taking a short position in MRK between $83.30 and $86.46. Soft sales for Keytruda, which accounts for over 45% of revenues, stood out. The narrowed 2025 sales outlook added a bearish catalyst, and I see more downside ahead due to struggling sales and elevated input costs.
- MRK Entry Level: Between $83.30 and $86.46
- MRK Take Profit: Between $73.32 and $76.66
- MRK Stop Loss: Between $88.11 and $90.75
- Risk/Reward Ratio: 2.08
More By This Author:
BTC/USD Forex Signal: Slanted Bearish Head & Shoulders Chart PatternThe Best Undervalued Stocks To Buy Now
The Best Oil Stocks To Buy Now - Sunday, Nov. 2
Risk Disclaimer: DailyForex will not be held liable for any loss or damage resulting from reliance on the information contained within this website including market news, analysis, trading signals ...
more


