Mean Green Line
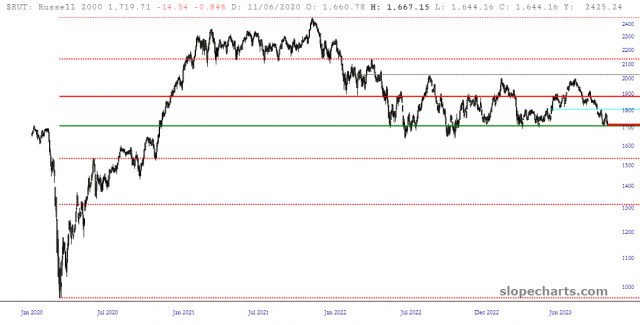
Below is a chart of the Russell 2000 cash. See that green horizontal? That has provided reliable support through this entire bear market. Break it, and an entire new phase of the bear begins.
Here’s hoping……………
More By This Author:
Incredibly Consistent
Post-CPI ETF Examination
The Fate Of Dine Equity
I tilt to the bearish side. Slope of Hope is not, and has never been, a provider of investment advice. So I take absolutely no responsibility for the losses – – or any credit ...
moreComments
Please wait...
Comment posted successfully
No Thumbs up yet!


