
(Click on image to enlarge)

In this graphic, we visualize the world’s largest stock markets by country in 1900 and in 2023. This is based on each country’s percentage share of global market capitalization.
Data for 1900 comes from the DMS Database, accessed via the UBS Global Investment Returns Yearbook 2024. Figures for 2023 are based on the FTSE Russell All-World Index Series Monthly Review (Dec 2023).
Data and Key Takeaways
All of the data we used to make this graphic can be found in the tables below.
Starting with 1900, we can see that the UK accounted for nearly one quarter of global market cap.
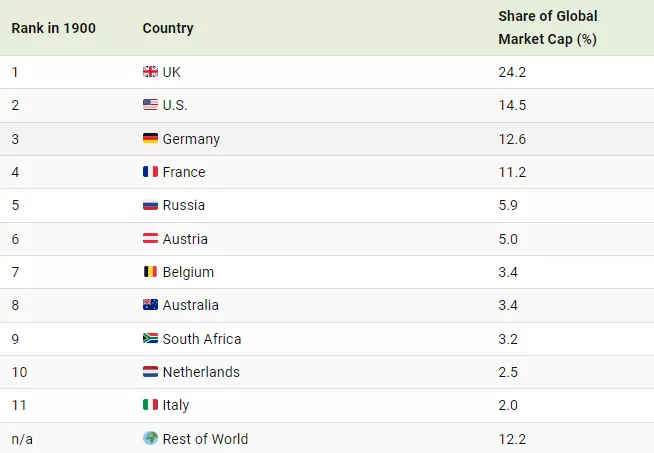
Founded in 1801, the London Stock Exchange (LSE) is one of the world’s oldest stock exchanges, though not as old as the New York Stock Exchange (NYSE) which opened in 1792.
Major companies that traded on the LSE in 1900 were primarily involved in railways, finance, and natural resources.
Overall, European countries accounted for over 67% of the global market cap in 1900. Looking at 2023’s data, we can see that much has changed since then.
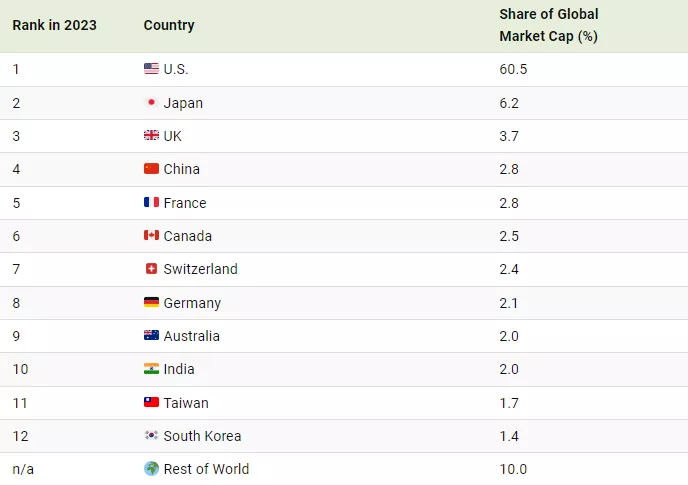
123 years later, the U.S. is firmly positioned as the world’s largest stock market. America’s share of global market cap has grown by 46 percentage points, and it is home to six of the world’s seven trillion-dollar companies.
Over this time frame, we can see that Asian countries like Japan, China, and India have also emerged as major equity markets. The latter two countries are expected to have the world’s two biggest economies by 2075, and as a result, the size of their stock markets could grow significantly.
More By This Author:
Charted: U.S. National Debt Reaches $35 TrillionCharted: The Countries Using The Most Energy Per Capita
Ranked: The Most Visited Websites In 2024


Comments
Log in or sign up to join the conversation.