

Image: Bigstock
We have seen some awe-inspiring results from Microsoft (MSFT - Free Report), Meta Platforms (META - Free Report), and Amazon (AMZN - Free Report) in recent days that reconfirm their leadership position in this market.
These companies, along with their peers in the ‘Magnificent 7’ group of stocks – Apple (AAPL - Free Report), Alphabet (GOOGL - Free Report), Tesla (TSLA - Free Report), and Nvidia (NVDA - Free Report) – led the market higher last year, and that momentum has continued this year.
Other than Tesla, whose results disappointed the market once again and reflected the fourth quarter in a row of disappointing results, all of the Magnificent 7 members that have reported came out with impressive growth numbers. The market wasn’t particularly impressed with the Alphabet and Apple reports, but they came out with Q4 earnings growth of +51.8% and +13.1%, respectively.
Tesla’s earnings were down -45.8% in Q3 on +3.5% higher revenues, as the EV-maker continued to grapple with weakening margins in an increasingly competitive EV market. The chart below shows the one-year performance of the Magnificent 7 stocks relative to the S&P 500 index and Tesla.
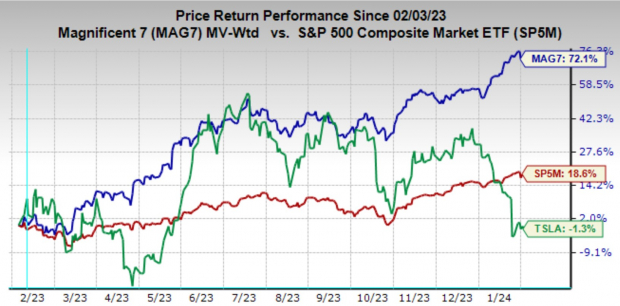
Image Source: Zacks Investment Research
The chart below shows the January 2024 performance of this group.
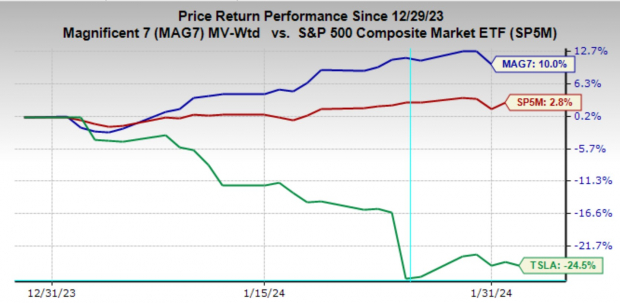
Image Source: Zacks Investment Research
Using estimates for Nvidia, which will be coming out with its December-quarter results on Feb. 21, and actual results for the other six members of the group, total Q4 earnings for the group are expected to be up +48.7% from the same period last year on +14.5% higher revenues.
The chart below shows the group’s Q4 earnings and revenue growth performance in the context of what we saw from the group in the preceding quarter, along with what is currently expected for the next three quarters.
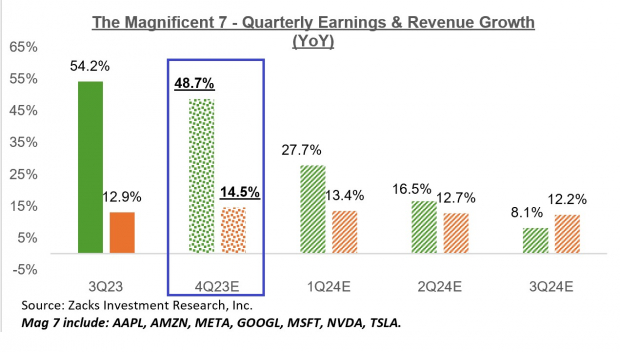
Image Source: Zacks Investment Research
The chart below shows the group’s earnings and revenue growth picture on an annual basis.
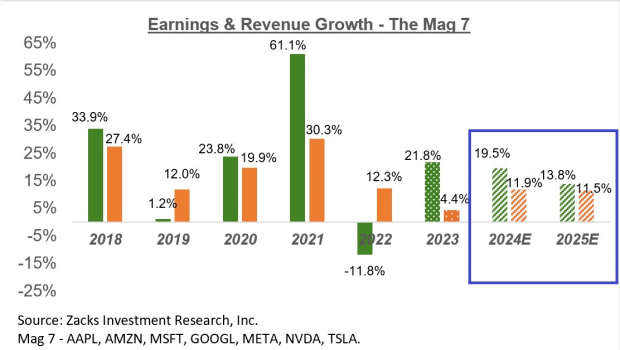
Image Source: Zacks Investment Research
Please note that the Magnificent 7 companies currently account for 28.6% of the S&P 500 index’s total market capitalization, and they are expected to bring in 19.5% of the index’s total earnings in 2024. For 2023 Q4, the Magnificent 7 group has a bigger weightage, bringing in 23.1% of all S&P 500 earnings.
The chart below shows the group’s earnings contribution to the index over time and what is currently expected for the next two years.
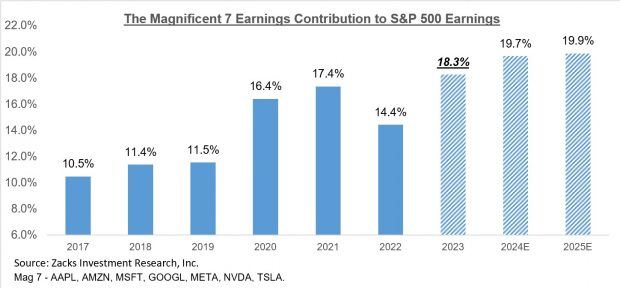
Image Source: Zacks Investment Research
Given their enormous earnings power and growth profiles, it is hard to argue with the group’s market leadership. Importantly, analysts had been raising their estimates for the group even before the December-quarter results, with these numbers now adding to the positive revision momentum.
Beyond these mega-cap players, total Q4 earnings for the Technology sector as a whole are expected to be up +24.2% from the same period last year on +8.1% higher revenues.
The chart below shows the sector’s Q4 earnings and revenue growth expectations in the context of where growth has been in recent quarters and what is expected in the coming four periods.
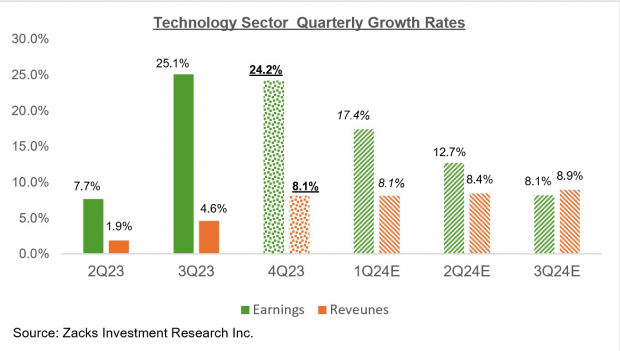
Image Source: Zacks Investment Research
The Earnings Big Picture
The chart below shows the earnings and revenue growth rates actually achieved in the preceding four quarters, as well as current earnings and revenue growth expectations for the S&P 500 index for 2023 Q4 and the following three quarters.
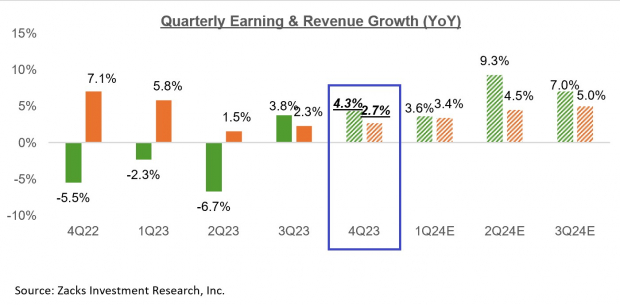
Image Source: Zacks Investment Research
This week’s blockbuster Tech results pushed the aggregate earnings growth picture for the S&P 500 index to +4.3% from last week’s +1.1% growth pace. Excluding the contribution from the Magnificent 7 stocks, Q4 earnings for the rest of the index would be down -4.2%, as the chart below shows.
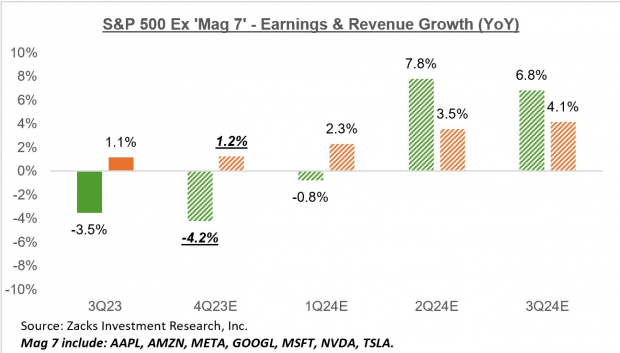
Image Source: Zacks Investment Research
The chart below shows the earnings picture on an annual basis.
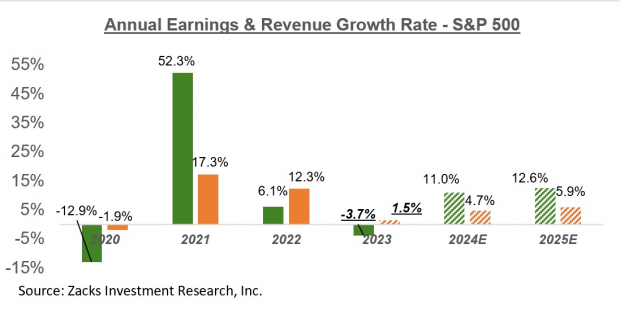
Image Source: Zacks Investment Research
Q4 Earnings Season Scorecard
Including all the results that came out through Friday, Feb. 2, we now have Q4 results from 230 S&P 500 members, or 46% of the index’s total membership.
We have more than 500 companies on deck to report results this week, including 106 S&P 500 members. This week’s line-up includes a who’s who of the index, including Disney, Elli Lilly, McDonalds, DuPont, Caterpillar, Ford, Pepsi, Chipotle, Uber, PayPal, Expedia, and many others.
Total Q4 earnings for the 230 index members that have reported already are up +4.2% from the same period last year on +2.8% higher revenues, with 81.3% beating EPS estimates and 63.9% beating revenue estimates.
The comparison charts below put the Q4 earnings and revenue growth rates in a historical context.
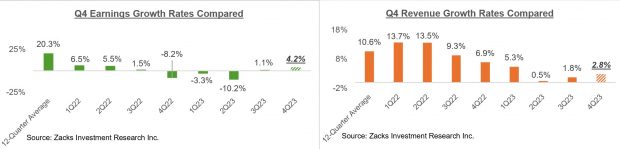
Image Source: Zacks Investment Research
The comparison charts below put the Q4 EPS and revenue beats percentages in a historical context.
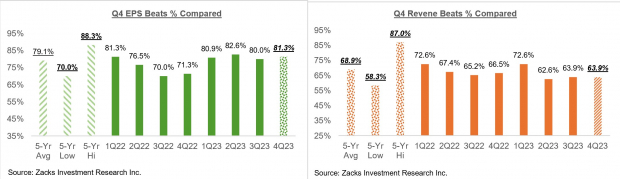
Image Source: Zacks Investment Research
More By This Author:
Q4 Earnings: Tech Flexes Strong GrowthBig Tech Earnings Loom: What Can Investors Expect?
Breaking Down The Q4 Earnings Season Scorecard


Comments
Log in or sign up to join the conversation.