Mag 7 Earnings Loom: What Can We Expect?
Image Source: Unsplash
- Total Q3 earnings for the 120 S&P 500 members that have reported results through Wednesday, October 23rd, are up +1.9% on +4.2% higher revenues, with 79.2% beating EPS estimates and 63.3% beating revenue estimates.
- The earnings growth pace for this group of 120 index members represents a deceleration from what we had seen in the first two quarters of the year, while the revenue growth pace is roughly in line with the recent trend line.
- Looking at Q3 as a whole, combining the actual results from the 120 index members that have reported with estimates for the still-to-come companies, total S&P 500 earnings are currently expected to be up +3.0% from the same period last year on +4.9% higher revenues.
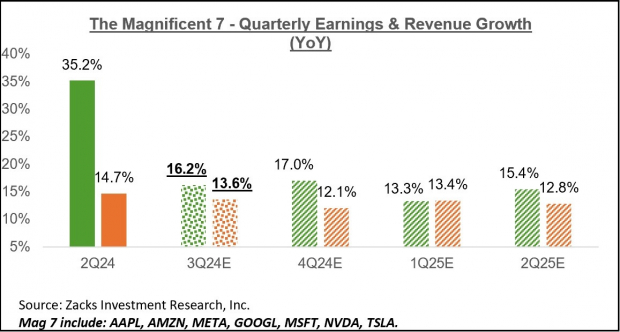
- Q3 earnings for the ‘Magnificent 7’ companies are expected to be up +16.2% from the same period last year on +13.6% higher revenues. This would follow the +35.2% earnings growth on +14.7% higher revenues in Q2. Excluding the ‘Mag 7’, Q3 earnings growth for the rest of the index would be down -0.1% (vs. +3.0% otherwise).
The Magnificent 7 Group's Outsized Earnings Contribution
The earnings focus shifts to the Tech sector in general and the Mag 7 companies in the coming days, with five members of the group – Apple (AAPL - Free Report) , Amazon (AMZN - Free Report) , Meta (META - Free Report) , Alphabet (GOOGL - Free Report) & Microsoft (MSFT - Free Report) – coming out with Q3 results next week.
The Mag 7 stocks appear to have ceded their market leadership role over the last few months, likely reflecting investors’ worries about ever-rising AI-centric capital expenditures without any clear ideas on how these massive investments will get monetized.
You can see this shift in the year-to-date chart below. Aside from Nvidia (NVDA) and Meta, the other five are now lagging the market.

Image Source: Zacks Investment Research
The Q3 earnings results in the days ahead will provide these companies another opportunity to make the case. This is particularly significant for Alphabet, Microsoft, and Amazon, though developments related to AI are relevant to all of them.
The market’s current issues with the Mag 7 stocks notwithstanding, there is no escaping the fact that these mega-cap operators are enjoying sustainable profitability growth. These seven companies collectively are on track to bring in $112.4 billion in earnings in Q3 on $487.3 billion in revenues. This represents year-over-year earnings growth of +16.2% on +13.6% higher revenues.

Image Source: Zacks Investment Research
The Mag 7 companies are on track to account for 21.3% of all S&P 500 earnings in Q3. In fact, had it not been for the Mag 7’s substantial earnings contribution, Q3 earnings for the remaining S&P 500 index would be modestly in the negative territory.
The Earnings Big Picture
Looking at Q3 as a whole, combining the actual results that have come out with estimates for the still-to-come companies, total earnings for the S&P 500 index are now expected to be up +3.0% from the same period last year on +4.9% higher revenues.
The Q3 earnings growth pace would improve to +5.3% had it not been for the Energy sector drag (decline of -25.6% for Energy). On the other hand, quarterly earnings for the index would be down -0.3% once the Tech sector’s hefty contribution is excluded (earnings growth of +11.7% for the Tech sector).
The quarterly earnings growth pace is expected to improve from next quarter onwards. You can see this in the chart below, which shows the overall earnings picture on a quarterly basis.

Image Source: Zacks Investment Research
For the current period (2024 Q4), total S&P 500 earnings are expected to be up +9.1% on +5.3% higher revenues. Q4 earnings would be up +10.9% had it not been for the Energy sector drag.
Estimates for the period have started coming down since the quarter got underway. Still, the pace and magnitude of negative revisions is less than what we had seen in the comparable period of Q3. You can see this in the chart below that shows how Q4 estimates have evolved in recent weeks.

Image Source: Zacks Investment Research
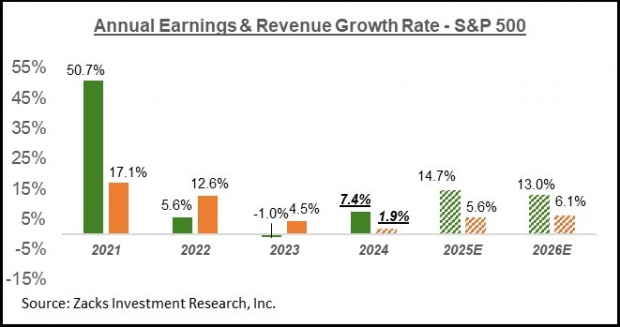
The chart below shows the overall earnings picture on an annual basis.

Image Source: Zacks Investment Research
Please note that this year’s +7.4% earnings growth on only +1.9% top-line gains reflects revenue weakness in the Finance sector. Excluding the Finance sector, the earnings growth pace changes to +6.4%, and the revenue growth rate improves to +4.2%. In other words, about half of this year’s earnings growth comes from revenue growth, with margin gains accounting for the rest.
More By This Author:
What Do Q3 Earnings Results Show?
The Q3 Earnings Season Kicks Off Positively
A Detailed Analysis Of Q3 Earnings Expectations


