
Macy's Stock Rallies And Fades Following Big Earnings Beat: What's Next?
Photo: Caldorwards4, Wikimedia
Macy’s Inc. M shares traded higher before parring gains Tuesday after the company reported better-than-expected fourth-quarter EPS and sales results. The company also issued 2022 sales guidance above analyst estimates and announced a $2 billion buyback.
Macy's reported quarterly earnings of $2.45 per share, which beat the analyst consensus estimate of $1.96 by 25%. The company reported quarterly sales of $8.66 billion, which beat the analyst consensus estimate of $8.43 billion by 2.79%.
Macy’s was down 2.2% at $25.12 at time of publication.
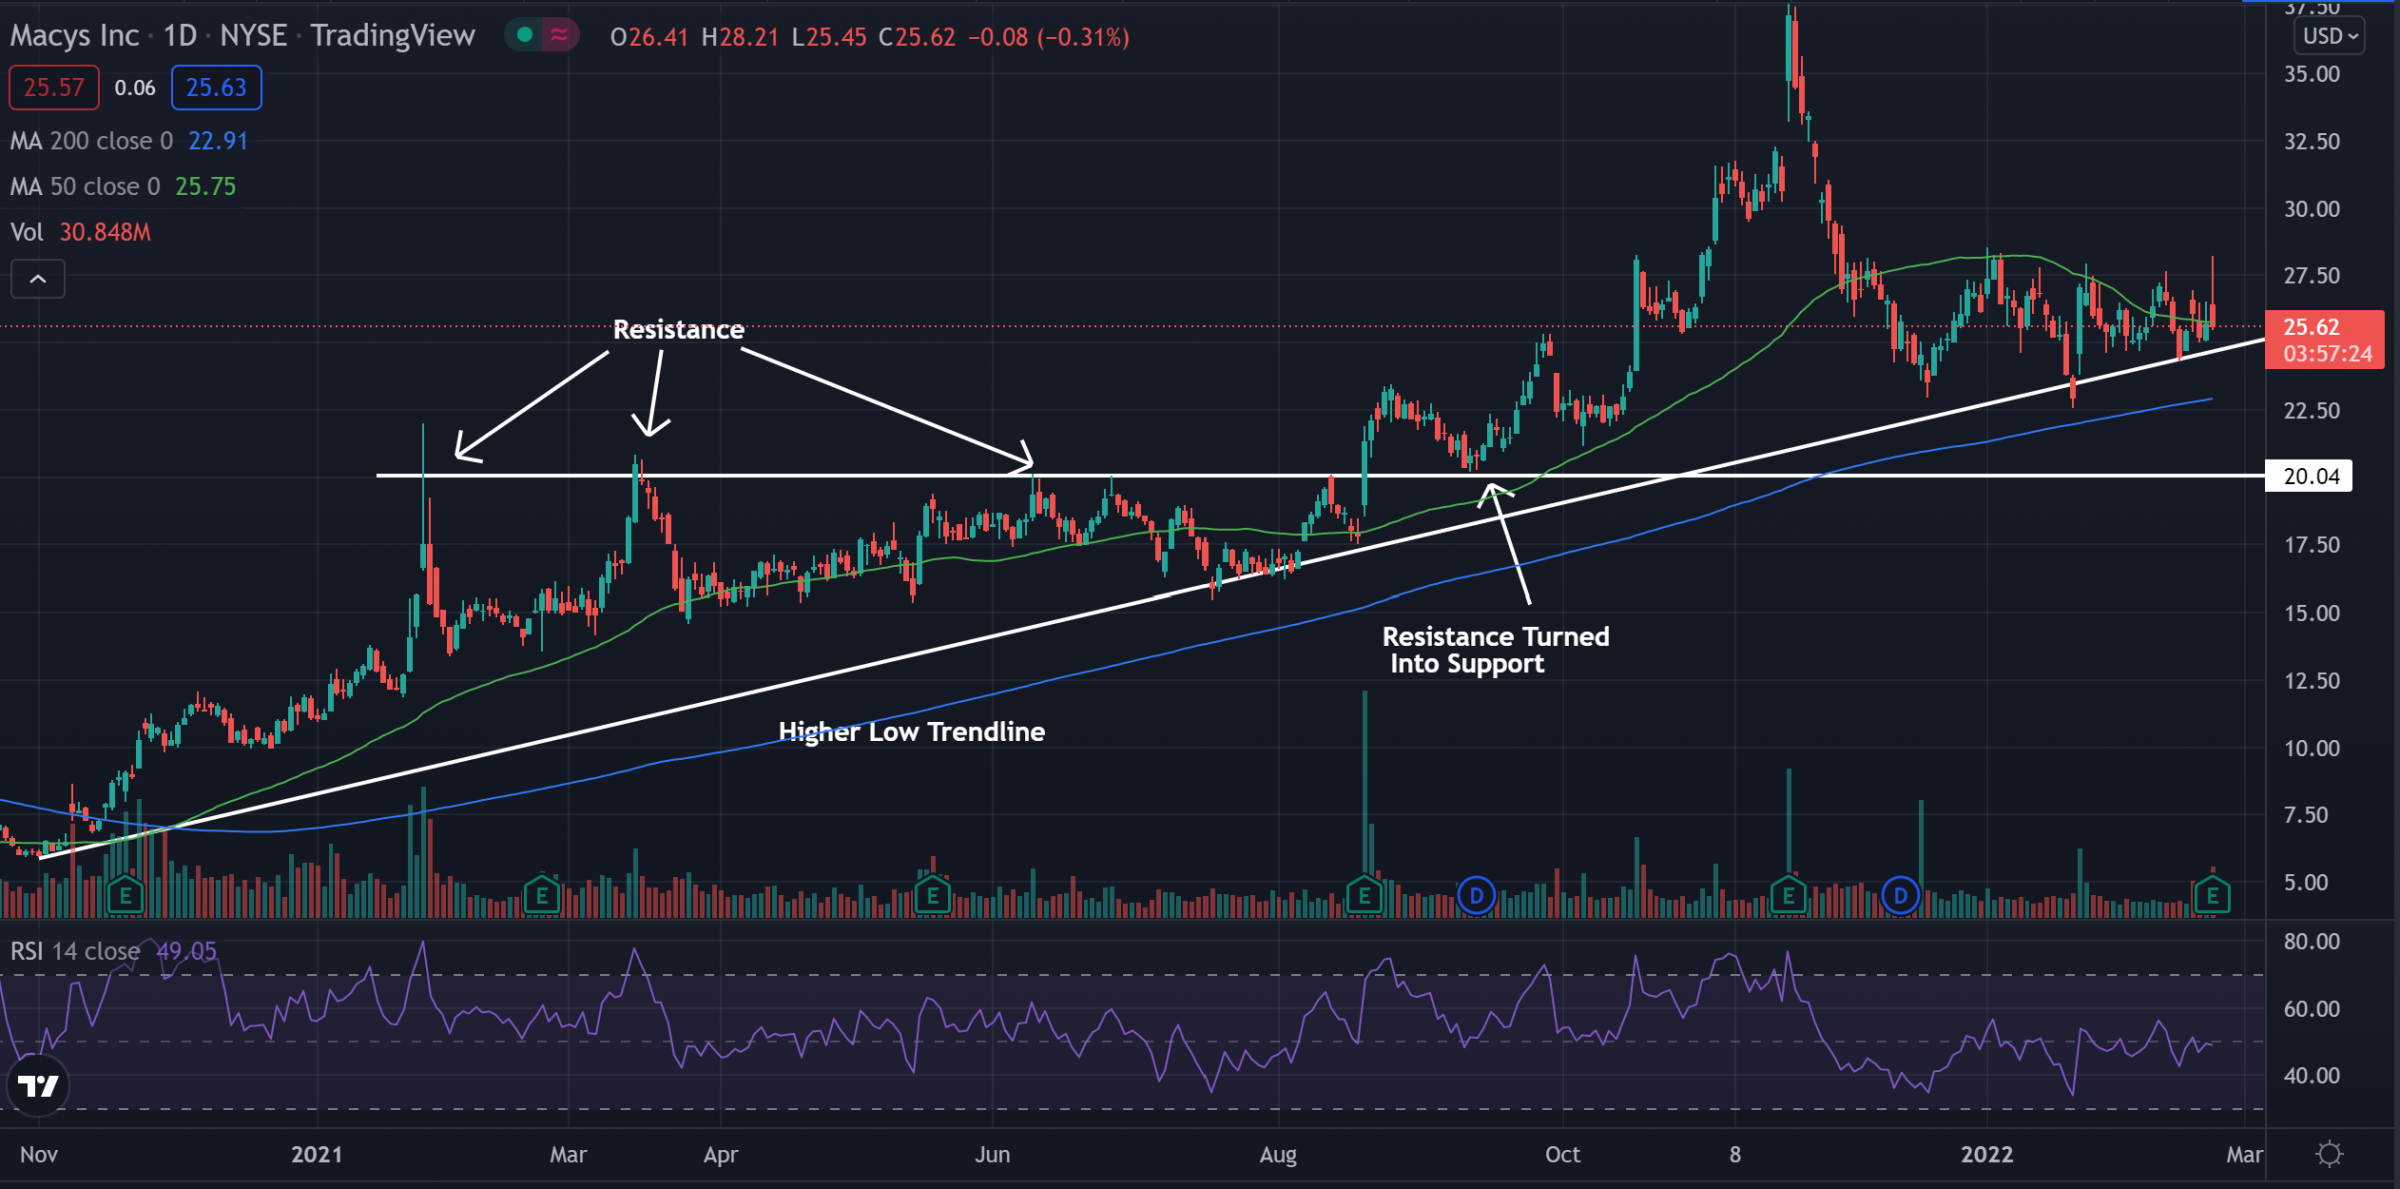
Macy’s Daily Chart Analysis
- Shares were able to break out of what traders call an ascending triangle pattern last October and have been able to continue to climb along the higher low trendline. This trendline is where the stock will most likely find support if the price were to break below the next area of support is near the $20 level, as this was an area of previous resistance in the pattern.
- The stock trades below the 50-day moving average (green) but above the 200-day moving average (blue). This indicates the stock is likely in a consolidation period, and the 50-day moving average may act as resistance while the 200-day moving average may hold as support.
- The Relative Strength Index (RSI) has been moving sideways throughout the past few months and sits at 48. The RSI moving sideways shows there is about the same amount of buyers and sellers in the stock.
(Click on image to enlarge)
What’s Next For Macy’s?
Macy’s is in a bullish period of movement and will stay this way as long as the stock is able to hold above the higher low trendline. Below this trendline, things will start to look slightly more bearish. The $20 level is the last indicator to show the bullish period of movement; in other words, a drop below the level may start a bearish period of movement.
Bulls want the trendline to hold and for the RSI to stay above the middle line. Bears want to see a break below the higher low trendline and for the price to break below the $20 level.
© 2022 Benzinga.com. Benzinga does not provide investment advice. All rights reserved.


