
Look For These Candlestick Patterns To Make More Money
I recently showed you how you can use Japanese "candlestick" charts to detect real-time changes in the momentum of the market.
Knowing how to read these charts is critical to making sure you're on the right side of the action, every time.
That's because the charts themselves can fill you in on emerging trading patterns. Today I want to teach you how to spot some patterns that I tend to take very seriously whenever I see them playing out.
I'll even show you how to spot a looming reversal. You can start using your knowledge of these patterns to outwit, out-trade, and outperform the competition today, so let's get started.
Bulls and Bears: Who's Winning Today?
It helps to think of bulls or bears as being "in charge" of the market on any one day, dictating that all-important price action. Lots of selling, and you know the bears are calling the shots. Heavy buying tells you it's the bulls running the table.
We need to look for a sign (or signs) that whomever is in charge is running out of (orhas run out of) steam and a move in the opposite direction may be coming.
I favor using the following six patterns to position myself correctly when trying to find a reversal pattern and a move counter to the existing trend on the stock I'm analyzing.
Now, it's important to note that these patternswon't help traders pick precise market tops and bottoms, but when you trade on these patterns, you'll be as close as makes no odds. You'll get in near enough to a bottom (or top) to increase your earning power.
One more thing before we get started: The patterns you're about to see are all one, two, and three days in length. And the longer the pattern, the more potent the market psychology playing out on that security. The three-day pattern is more significant than the two-day, and the two-day is more important than the one-day.
Now, here are bullish candle reversal patterns…
Bullish Pattern No. 1: The Piercing
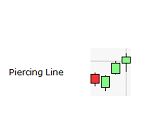
This is a two-day candle pattern where the bears were in charge the day before, closing lower than the open, followed by a day in which the stock gapped lower and not only closed higher on the day, but also pierced the previous bearish day.
The greater the pierce the better, meaning if the stock today closes 50% or more into the previous day's real body, it would be more ideal than it just nudging into the previous day's real body.
Bullish Pattern No. 2: The Engulfing
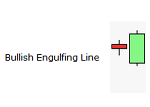
This is another two-day candle pattern, where a bearish candle day is followed by a bullish candle day. The difference here is that unlike the Piercing Pattern, which only pierces or closes inside the previous day's real candle body a certain amount, today's bullish candle totally engulfs the previous day's real body. This tends to be more significant than the Piercing Pattern.
Bullish Pattern No. 3: The Morning Star Reversal
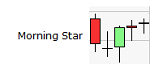
This is a three-day pattern, which is of course more significant than one- or two-day patterns. The Morning Star Reversal's first day is a bearish candle. The second, or middle, day is typically a "doji," a day of indecision, and the third day then comes in and is a bullish candle. The more the third day's close pierces the first day's real body, the better. Ideally a close 50% or greater is ideal.
Bullish Pattern No. 4: The Kicker
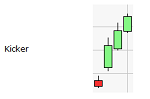
This is a two-day pattern, but because the reversal is a bit more dramatic, it is deemed one of the most reliable two-day candle patterns.
The first day is a bearish day, but the following day gaps open and continues on for the rest of the day, closing higher than the open (a bullish day). The fact that it opened with a gap opposite the downtrend, remained bullish virtually the whole day, and finished higher gives more of an indication the bulls are gaining back control and higher prices are likely to follow.
When you see these patterns emerge, consider buying call options, or setting up loophole/call debit spreads, or buying put calendar spreads. You may also consider buying the shares.
Now here are some bearish candle reversal patterns.
Bearish Pattern No. 1: Dark Cloud Cover
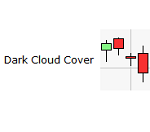
This is a two-day pattern where the first day is a bullish day followed by a day that gaps higher on the open and then finishes as a bearish day, where the close of the day is not only lower than its open, but also closes in the real body of the previous day. Like its opposite the Piercing Pattern, a close of the second day that's 50% or greater of the first day's real body is more ideal.
Bearish Pattern No. 2: The Engulfing
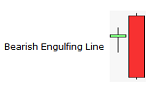
This two-day candle pattern is formed when a bullish candle day is followed by a bearish candle day. The difference here is that unlike the Dark Cloud Cover, which only closes inside the previous day's real candle body a certain amount, today's bearish candle, the real body, totally engulfs the previous day's real body. This tends to be more significant than the than the Dark Cloud Cover.
Bearish Pattern No. 3: The Evening Star Reversal
This is a three-day pattern. The Evening Star Reversal's first day is a bullish candle. The second day is typically a "doji," a day of indecision, and the third day then comes in and is a bearish candle. The more the third day's close pierces the first day's real body, the better. Ideally a close 50% or greater is ideal.
Bearish Pattern No. 4: The Kicker
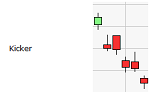
This is a two-day pattern, but because the reversal is a bit more dramatic, it is deemed one of the most reliable two-day candle patterns.
The first day is a bullish day, but the following day gaps open and continues on for the rest of the day, closing lower than the open (a bearish day). The fact that it opened with a gap opposite the uptrend, remained bearish virtually the whole day, and finished lower gives more of an indication the bears are gaining back control and lower prices are likely to follow.
So when you see these bearish patterns emerge, consider buying puts, or a loophole put debit spread, or call calendar spreads. You may also want to short the stock.
Where the Pattern Occurs Is Important
I like to combine my analysis of Western technicals with the Japanese candlesticks.
For instance, if I get a Money Calendar signal, or I see moving average crossovers I favor occurring alongside a bullish continuation or bullish reversal signal, that gives me even more conviction to pursue a trade – certainly more than a trade with fewer favorable indicators.
And where the bullish or bearish candle structure appears on the chart helps determine whether the pattern is valid.
For example, let's say we see the two-day structure of a Piercing Pattern where today's close ended higher than its open, and the close pierced, or ended up in the previous day's real body, ideally by 50% or more.
But then we might see that this is happening at a resistance level – a double- or triple-top area. This would invalidate that two-day pattern as a reversal.
Here's why…
The key is in the label of the pattern: a Piercing Pattern is a bullish pattern – a bullish reversal pattern. If a stock is at resistance, and it reverses, it will move to the downside. And yet a bullish pattern should go up; a stock trending up will never "reverse up," so that pattern can't be a bullish reversal pattern.
So, when you're looking to validate a pattern, a good rule of thumb is to look for bearish candle reversal patterns, like the bearish patterns above, at resistance. On the other hand, look for bullish candle reversal patterns at support levels.
Good trading!
Disclosure: None


