
(Click on image to enlarge)
“‘Knockin’ on Heaven’s Door’ is a song by American singer-songwriter Bob Dylan, written for the soundtrack of the 1973 film Pat Garrett and Billy the Kid. Released as a single two months after the film’s premiere, it became a worldwide hit, reaching the Top 10 in several countries. The song became one of Dylan’s most popular and most covered post-1960s compositions, spawning covers from Eric Clapton, Guns N’ Roses, Randy Crawford, and more.” Wikipedia
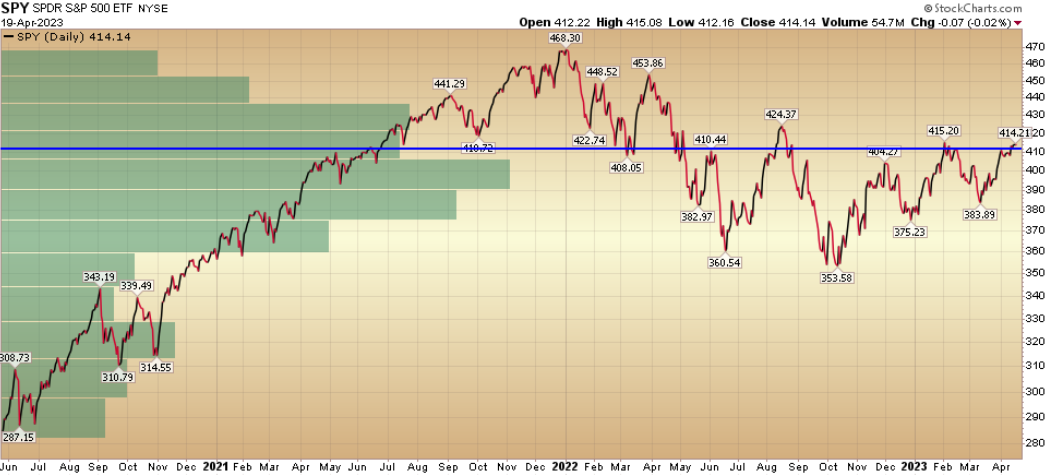
As you can see from the featured chart above, we’ve come through the “point of control” (volume by price – left side) on the S&P 500. This simply means there is less “overhead supply” to come on the market as we press higher. Now we are working on pushing through the “neckline” on the inverse “head and shoulders” pattern. While we don’t place much weight on technicals, they do offer a barometer on where we are in the process.
For the fundamental reasons we believe the market can work higher over time, we joined Dave Briggs and Seana Smith on Yahoo! Finance on Tuesday to discuss the backdrop. Thanks to Taylor Clothier, Seana, and Dave for having me on.
Here were my notes ahead of the segment:
Earnings:
-As they say, “the secret to happiness is low expectations.” That could not ring more true than this earnings season.
-So far ~10% of S&P 500 companies have reported earnings for Q1. The EPS beat rate is 83% and the average beat is +6%.
-This compares with expectations of -6.3% earnings growth.
-62% beat rate on top line (median +5%).
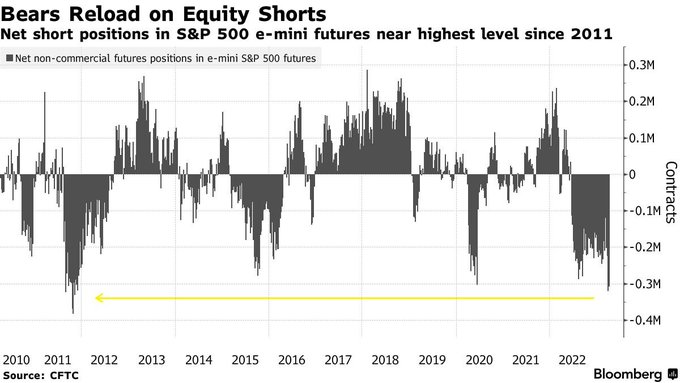
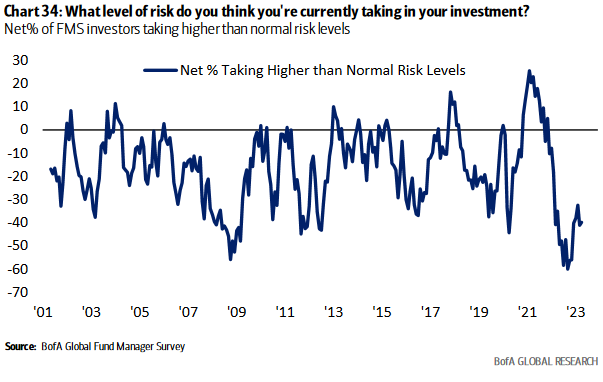
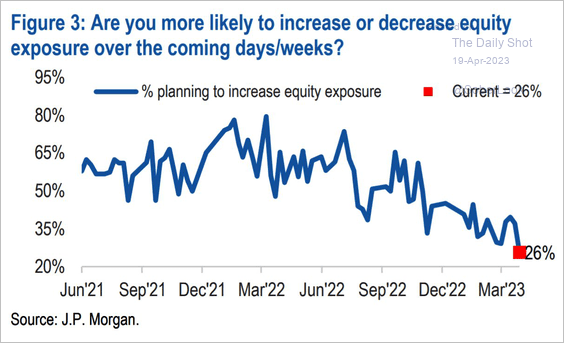
Positioning:
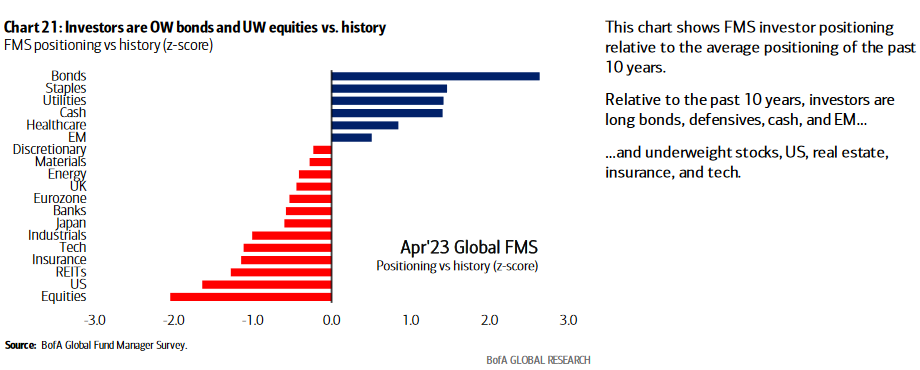
Managers are positioned for the apocalypse.
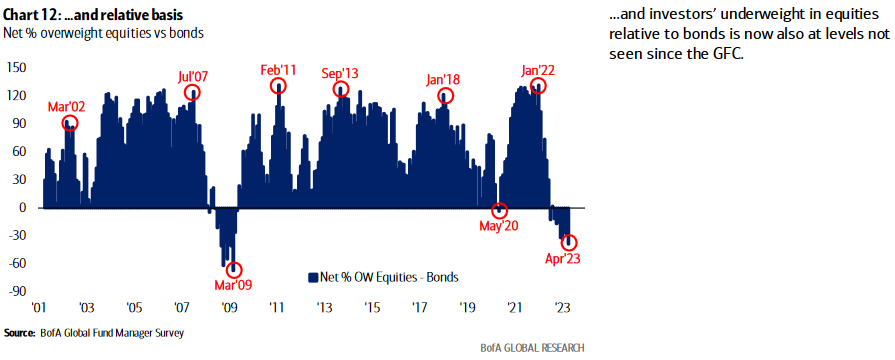
BofA Fund Manager Survey out this week:
· More OW Bonds v. Stocks than March 2009 GFC lows.
(Click on image to enlarge)
·Growth Expectations lower than GFC lows in 2009 and Pandemic lows in 2000.
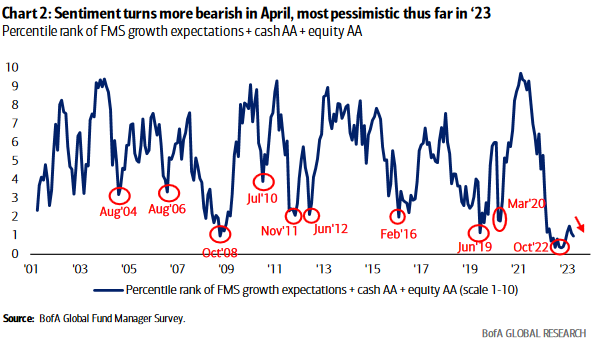
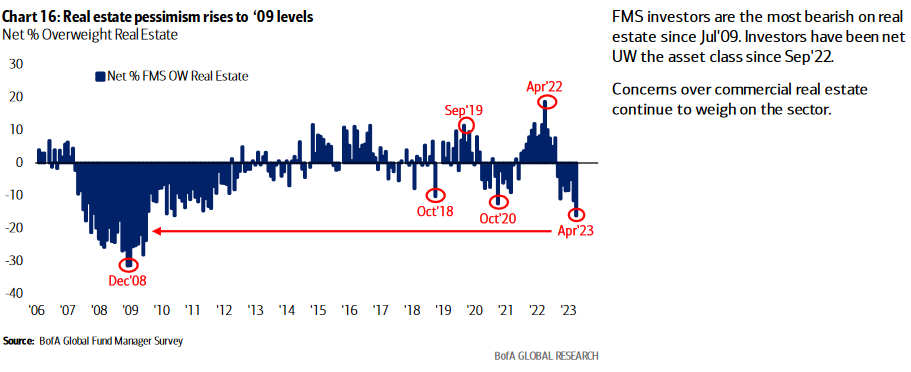
Risk Levels at 2009 lows levels.
Real Estate Pessimism at to GFC levels.
(Click on image to enlarge)
MARKETS DON’T TOP WHEN MANAGERS ARE OVERWEIGHT BONDS AND CASH. THEY TOP WHEN EVERYONE IS OVERWEIGHT STOCKS WITH LEVERAGE AND THERE ARE NO MARGINAL BUYERS LEFT. WE ARE NOWHERE NEAR THIS LEVEL.
Fed 0-1 more hike means rates subdued.
What works when tightening cycles are ending (rates moderating) and growth is below trend? REITS and Healthcare.
2 major “out of favor” picks (our specialty). Need Strong Stomach and 12-24 month holding period. Buy when there’s blood in the Streets:
VNO (starter position) initiated in March. 12-24 month+ hold (can be double +).
From Pre-Pandemic (2019):
-Rental Revenues down 4.9%
-Book Value per share DOWN 16.45%
-FFO (Funds From Operations) per share down 9.74%
-Occupancy rate in their NYC properties 90.4% down from 91.3%
-Stock Price Down 75%
-THESE DIVERGENCES BETWEEN PRICE AND FUNDAMENTALS IS WHERE BIG GAINS ARE MADE OVER TIME. AS BEN GRAHAM SAID, “MR. MARKET IS A MANIC DEPRESSIVE.” TAKE ADVANTAGE OF THE EMOTIONS VERSUS BEING AT THE EFFECT.
-Already cut dividend in Jan (43% from 2019 levels). Yield still above 10%. Plenty of room to cut again if needed, but unlikely.
-Trading at 40% discount to book.
-If they didn’t take Steve Roth out on a stretcher during the GFH in 2008-2009 (where it’s trading now), it’s not going to happen now. He’s one of the best operators in the business. —
-Similar to MALL crisis a few years ago. “B” & “C” properties were taken out. “A” properties made it (SPG) through fine.
-Vornado is Park Ave, Madison Ave, 5th Ave, 6th Ave, 7th Ave, Central Park South, Times Square, Penn Station, Lexington. Simply put, they own the best properties in the best city in the world. If you think demand is dead for that, there’s a lot more to worry about than Steve Roth.
Healthcare: Basket of biotech (XBI). Fed at or near end of tightening cycle. XBI Bottomed in May, traded sideways for months. Recent retest/pullback will hold.
We believe the move is just beginning and should be strong over next 1-2years (in a slower GDP growth environment). Similar situation in 2015-2018 (crashed 50% due to tightening cycle, up ~135% over next 2 years off low).
-Besides historic low valuations – whether you look at Price/Sales, Price/Book, Price/Operating Cash Flow, Forward P/E, Percent trading at a discount to cash, etc the key catalysts are drugs and deals.
BofA quantitative study of where Biotech stocks are trading as a group (relative to their historic average multiple) implies the sector should appreciate:
>25% – to get back to average Price to Book multiple
>155% – to get back to average Price to Operating Cash Flow multiple.
>110% – to get back to average Forward P/E multiple.
Big Pharma has record cash and patent cliffs. Will have to buy innovation and growth. The cash balance of Russell 3000 Health Care companies exceeds $500B. This is up ~400% in the past 20 years.
Pfizer buying Seagen for $42B and Merck buying Prometheus for $11B are just the beginning.
Drug approvals have been coming in fast and furious since the focus has shifted from COVID (2020-2022) back to normal innovation (Alzheimer’s, Cancer, etc).
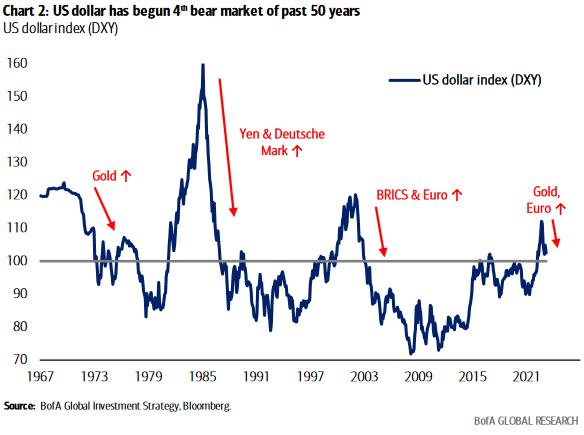
Dedollarisation
On the last podcast|videocast one of the AMA questions was about the fear of the U.S. Dollar loosing its reserve currency status. My quip response was that it was simply fear mongering often used by cassandras to sell books and clicks. This week I was invited back to CNBC “Closing Bell” Indonesia to discuss this exact subject in detail. Thanks to Safrina Nasution and producer Syfia for having me on.
Other Factors…
Upward revisions are inconsistent with imminent recession. Timing more aligned with “technical recession” that already occurred in Q1-Q2 2022:
(Click on image to enlarge)
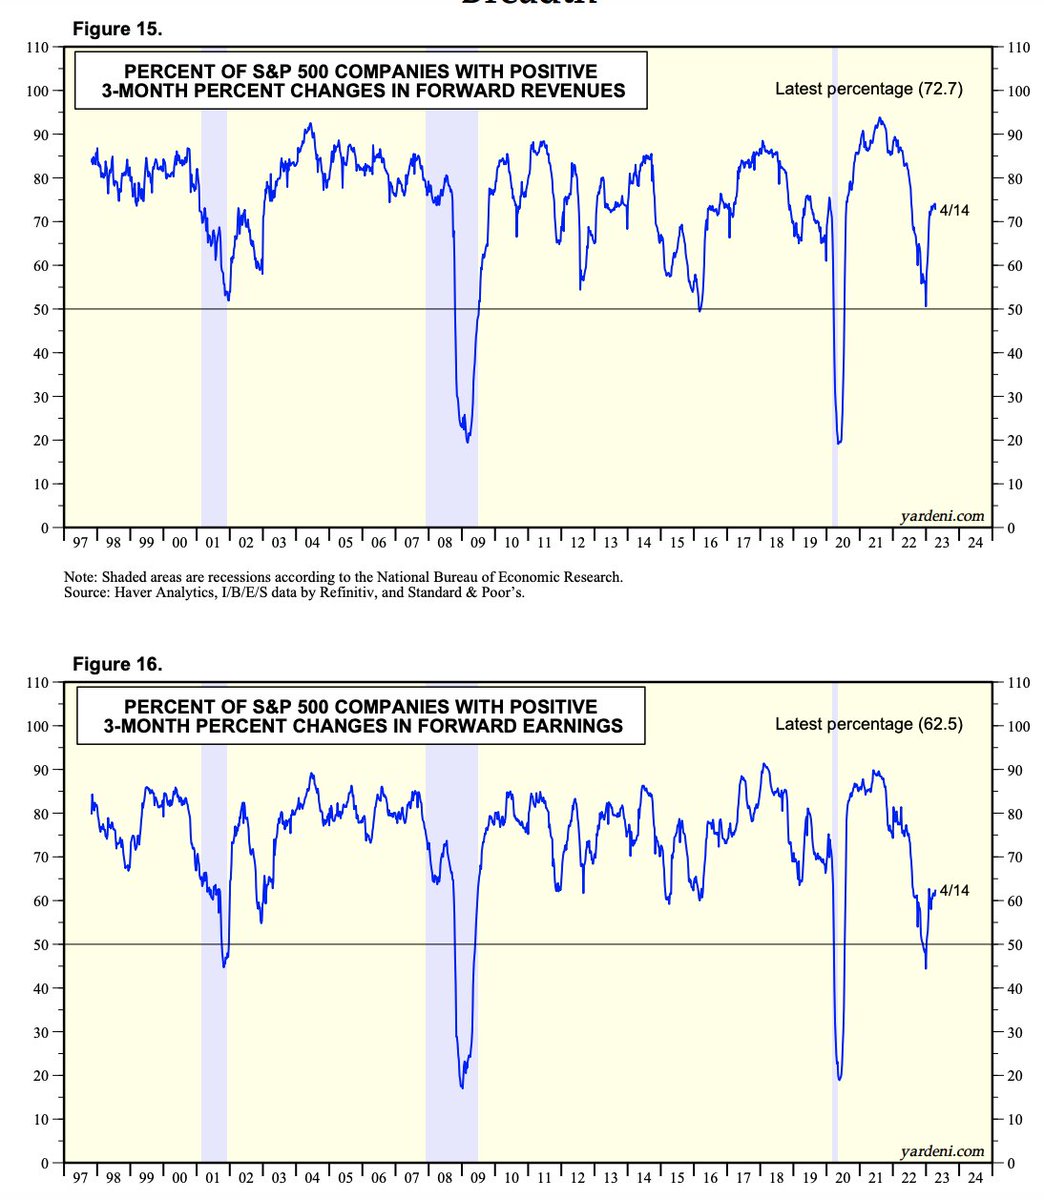
h/t Seth Golden
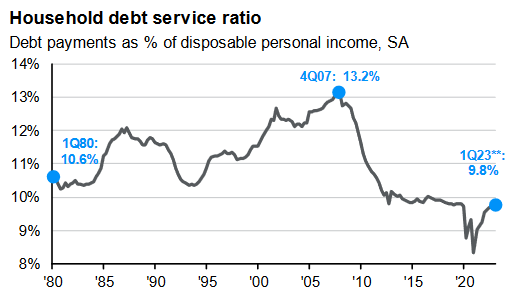
Consumers still have low debt service:
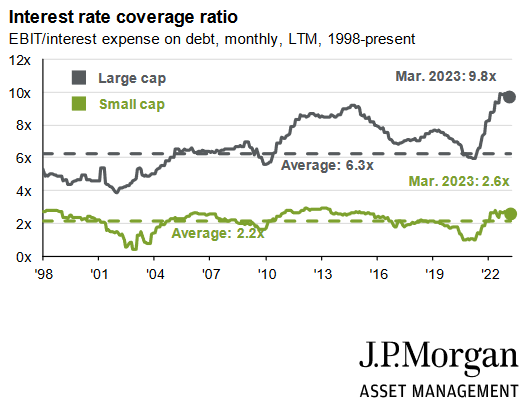
Company interest coverage is at multi-decade highs (i.e. healthy balance sheets):
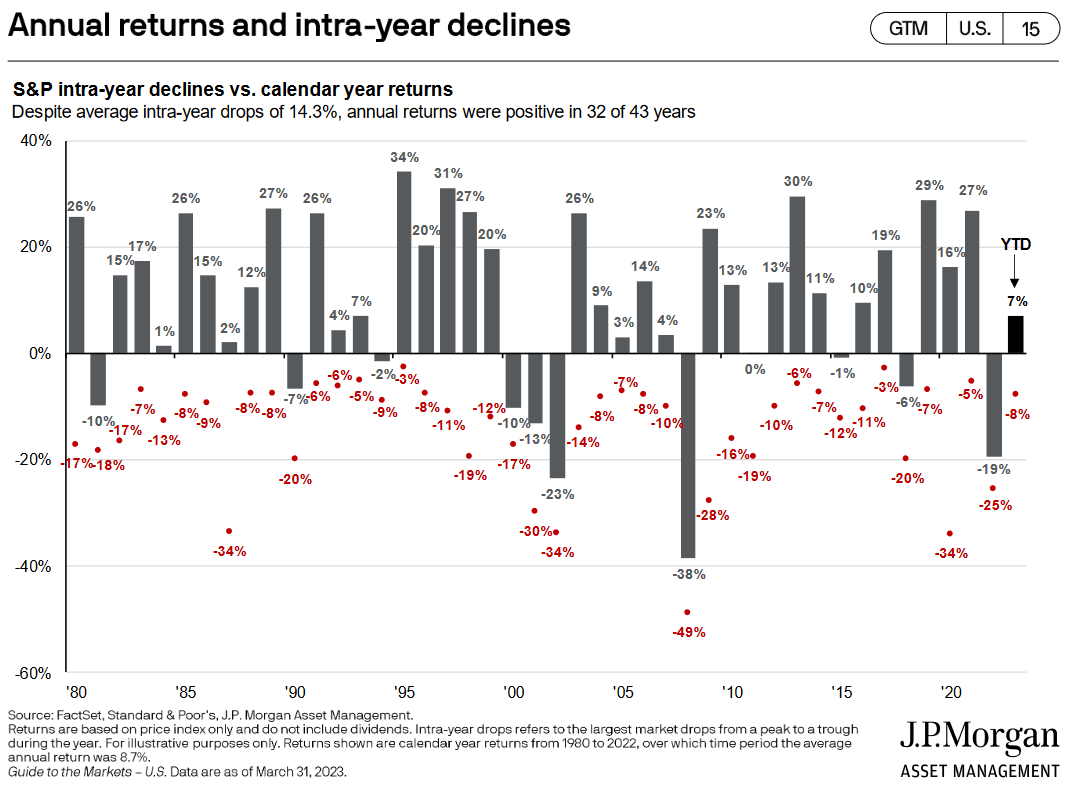
Returns following single negative years trend above average:
(Click on image to enlarge)
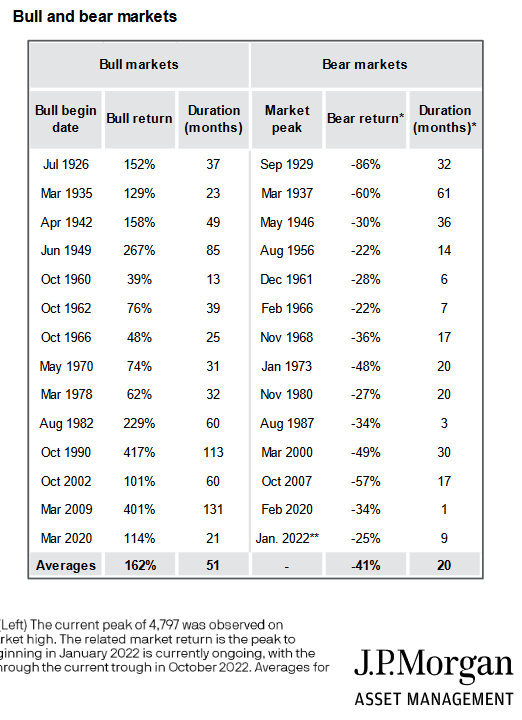
Bear market ends up 20% off lows. What happens next?
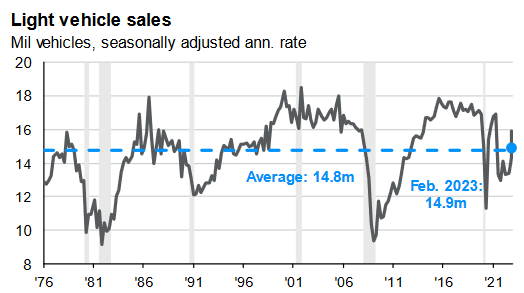
New Car Sales accelerating above average units:
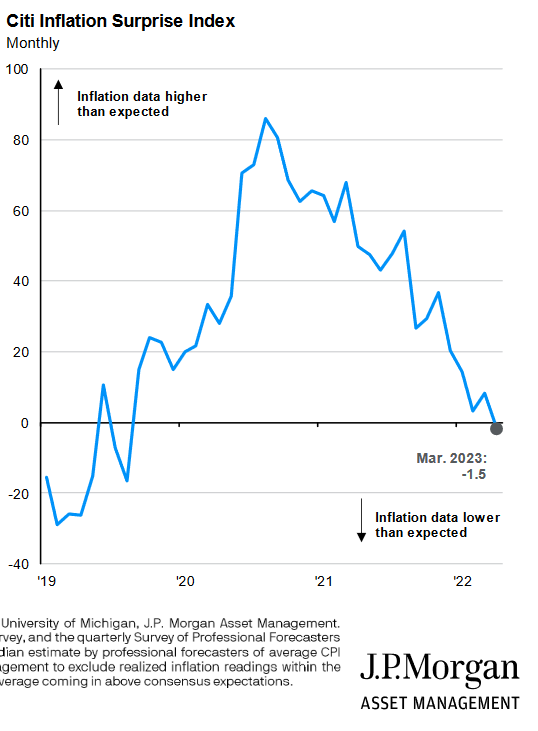
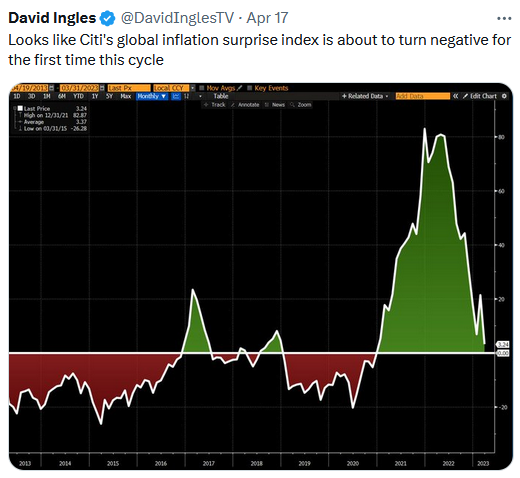
Inflation…
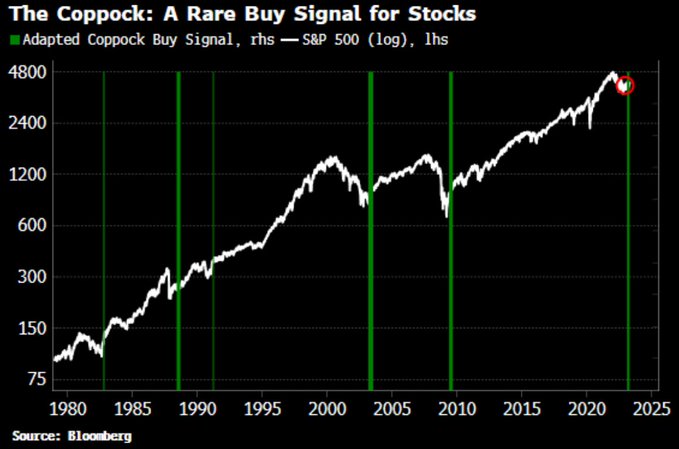
Coppock Curve Buy Signal:
Chronic Fear:
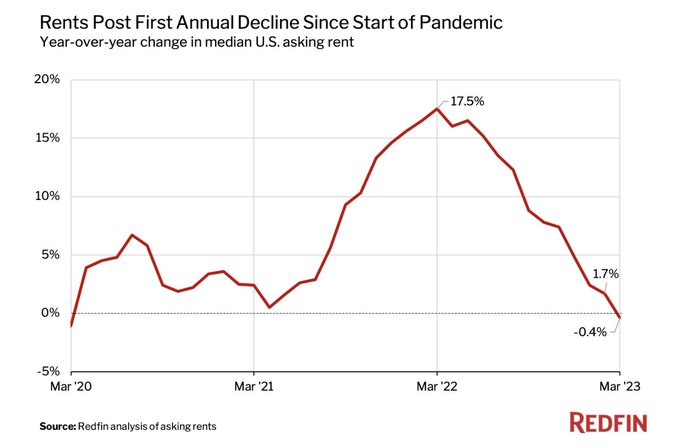
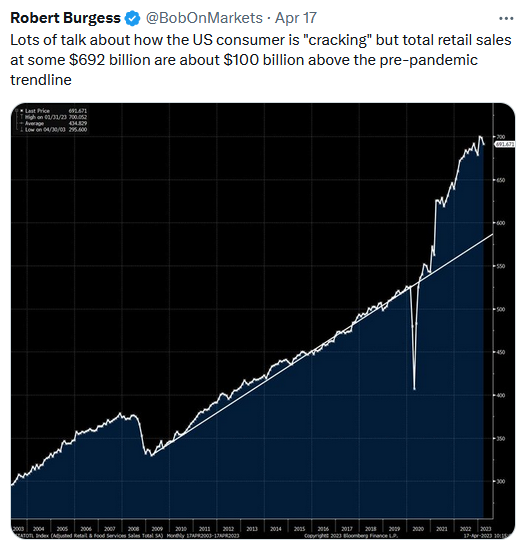
Rents:
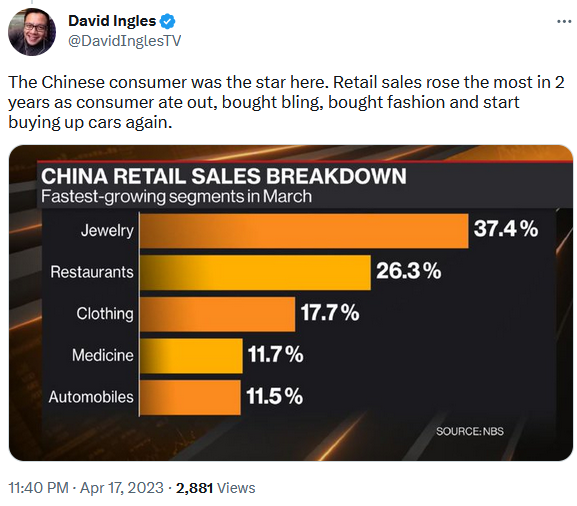
Retail Sales:
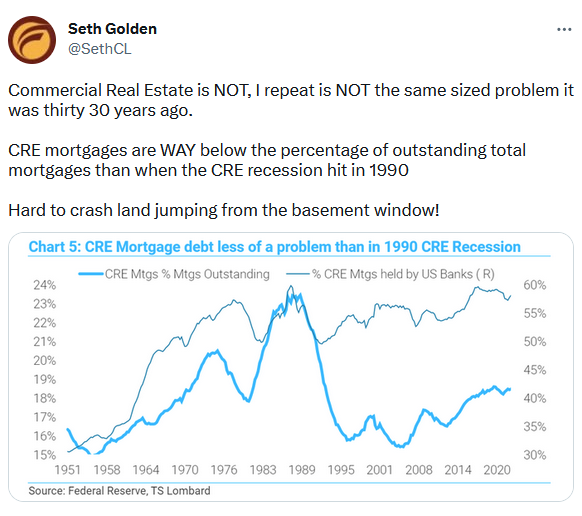
Commercial Real Estate:
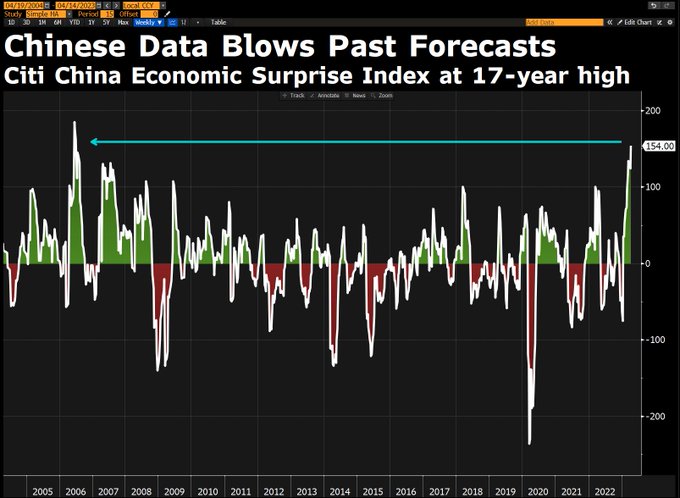
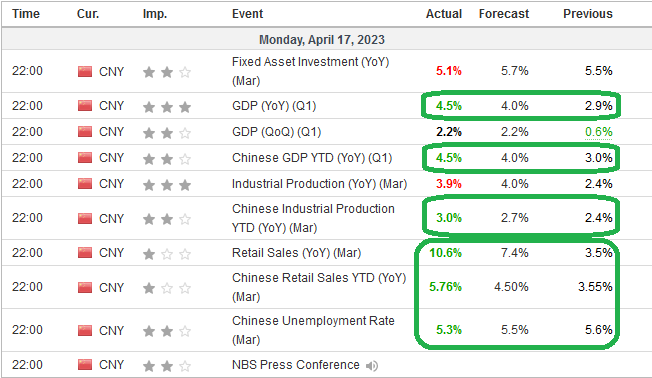
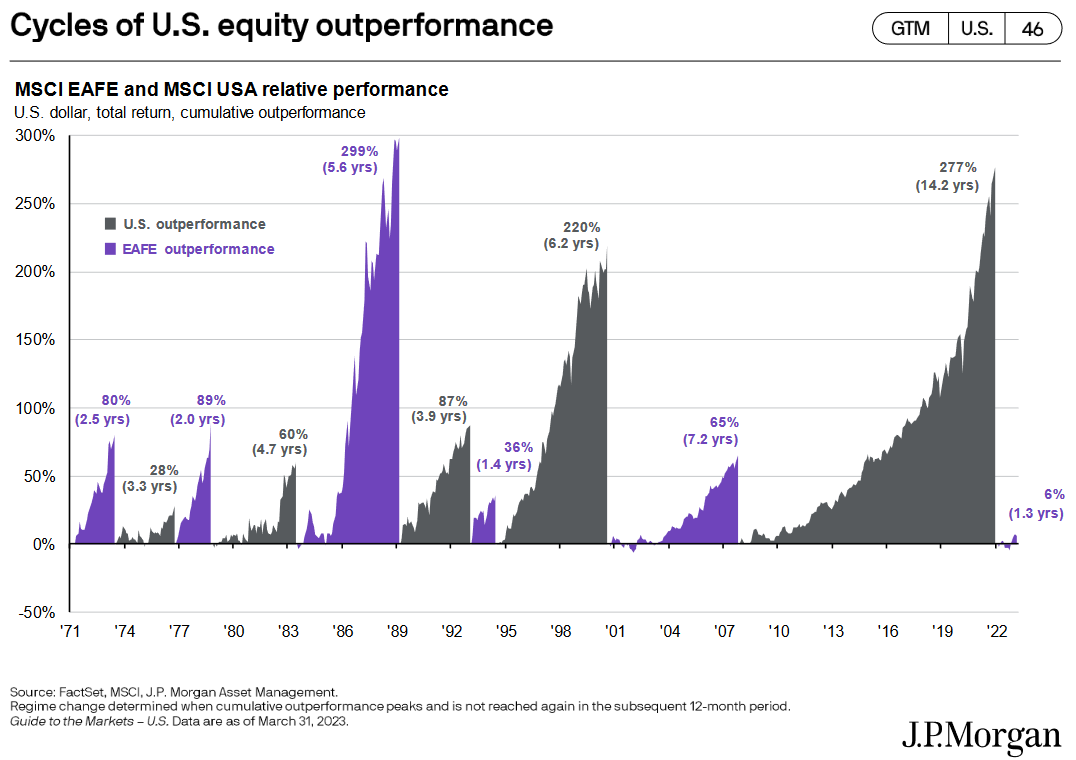
EX-US
China:
Dollar Weakening:
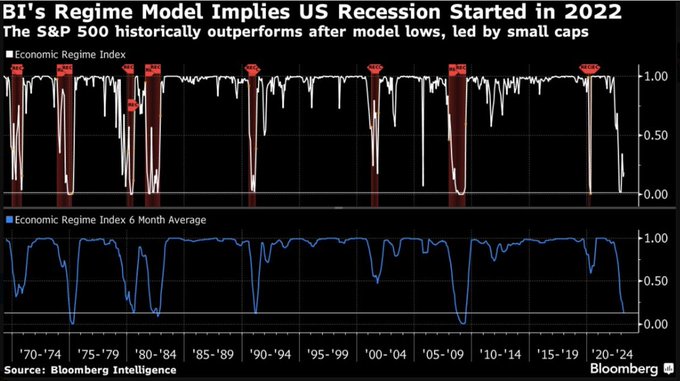
Regime Change:
(Click on image to enlarge)
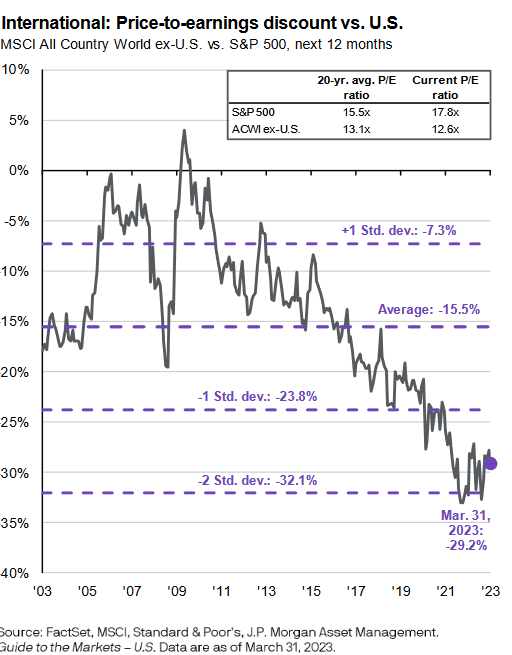
P/E Discount -2 Std. dev:
More Sentiment:
On Tuesday, I posted a summary of Bank of America’s Global Fund Manager Survey. You can find it here.
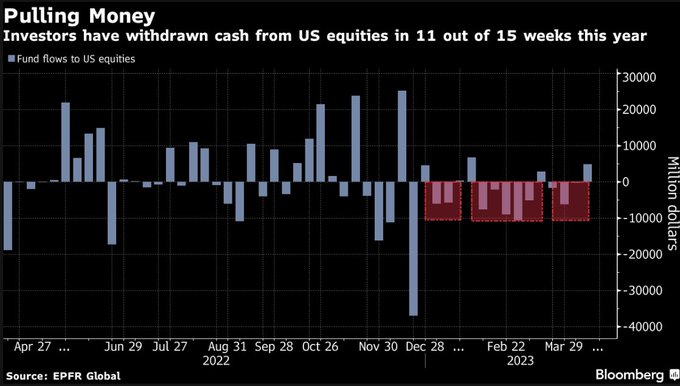
Managers crowded into Bonds and Cash. Out of Equities:
(Click on image to enlarge)
Now onto the shorter term view for the General Market:
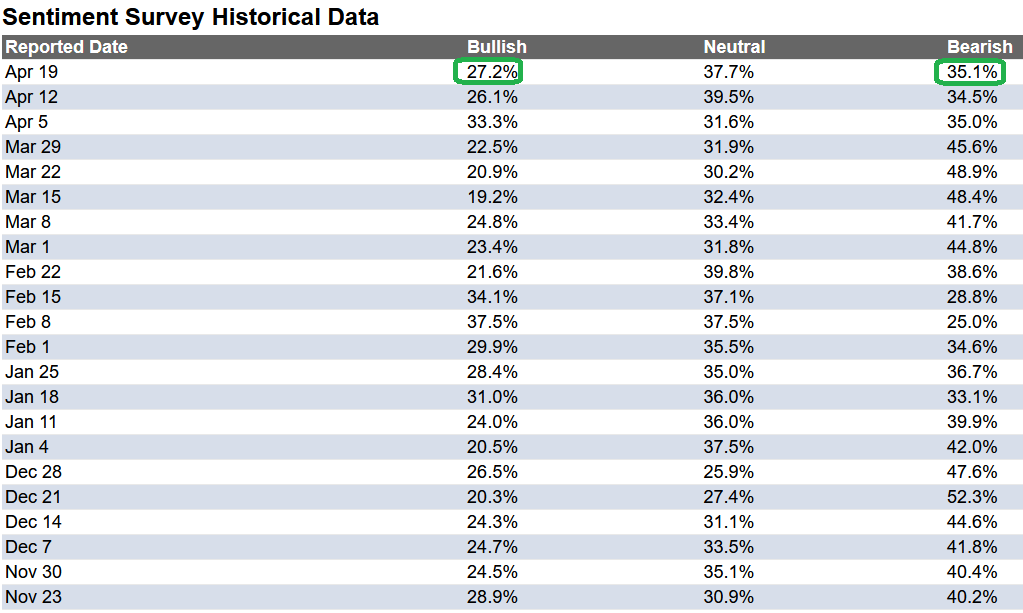
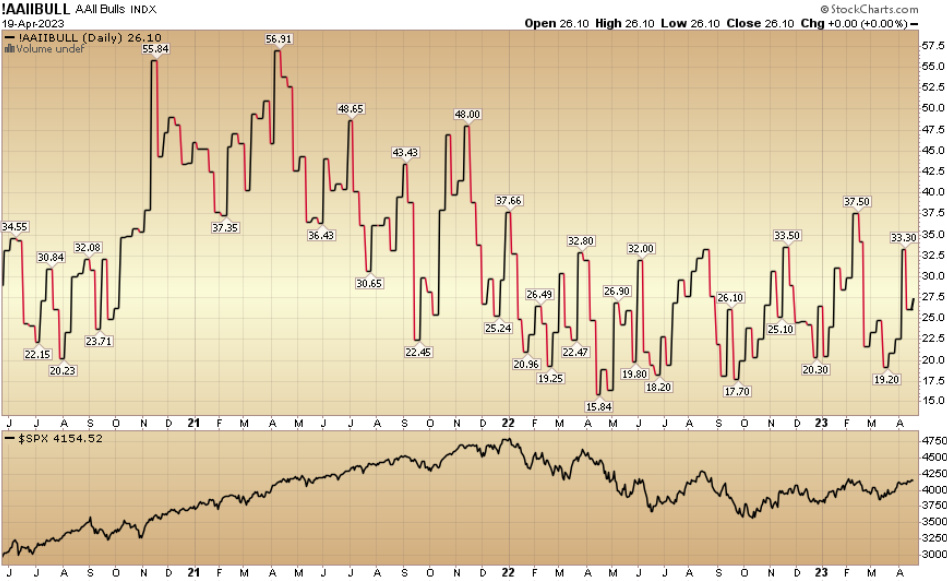
In this week’s AAII Sentiment Survey result, Bullish Percent (Video Explanation) ticked up to 27.2% from 26.1% the previous week. Bearish Percent ticked up to 35.1% from 34.5%. Retail investor fear is still present…
(Click on image to enlarge)
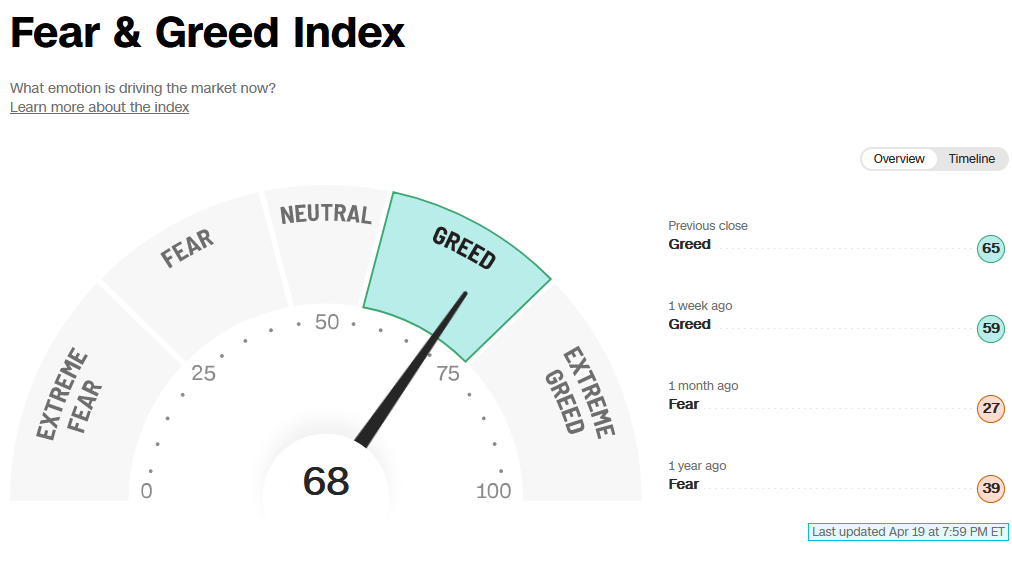
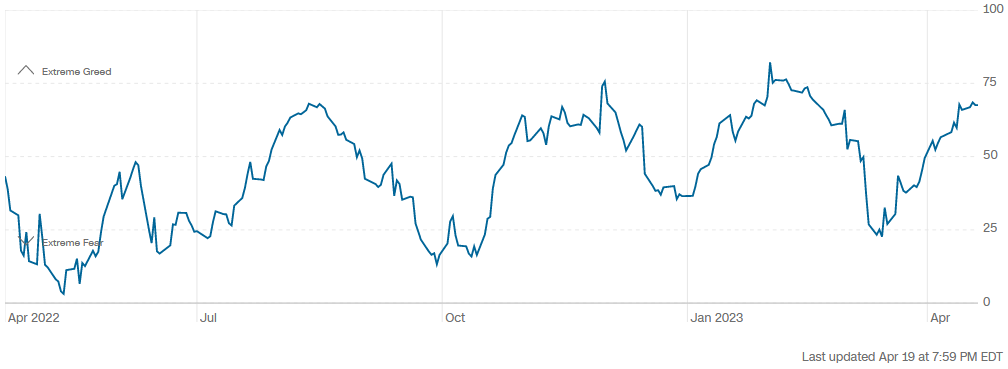
The CNN “Fear and Greed” rose from 62 last week to 69 this week. Sentiment is improving. You can learn how this indicator is calculated and how it works here: (Video Explanation)
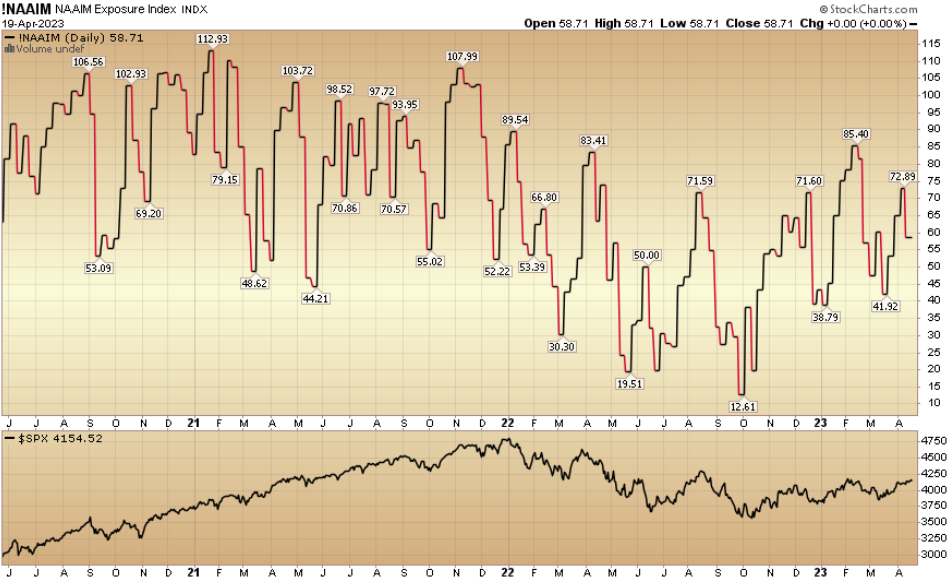
And finally, the NAAIM (National Association of Active Investment Managers Index) (Video Explanation) dropped to 58.71 this week from 72.89% equity exposure last week.
(Click on image to enlarge)
More By This Author:
“Snatching Defeat” Stock Market (And Sentiment Results)
“Stuck In The Middle With You” Stock Market (And Sentiment Results)
“Don’t Stop Believin'” Stock Market (And Sentiment Results)


Comments
Log in or sign up to join the conversation.