

Image Source: Unsplash
For this trade of the day, we will be looking at an On Balance Volume chart for KLA Corp. (KLAC), states Chuck Hughes of Hughes Optioneering. Before breaking down KLA Corp.'s On Balance Volume chart, let’s first review which products and services are offered by the company.
KLA Corporation is an original equipment manufacturer of process diagnostics and control equipment and yield management solutions required for the fabrication of semiconductor integrated circuits or chips. The company has a comprehensive portfolio of products addressing each major PDC subsegment’s photomask (reticle) inspection, wafer inspection/defect review, and metrology. Reticle production is vital to the semiconductor device formation process.
Confirming a Price Uptrend with On Balance Volume
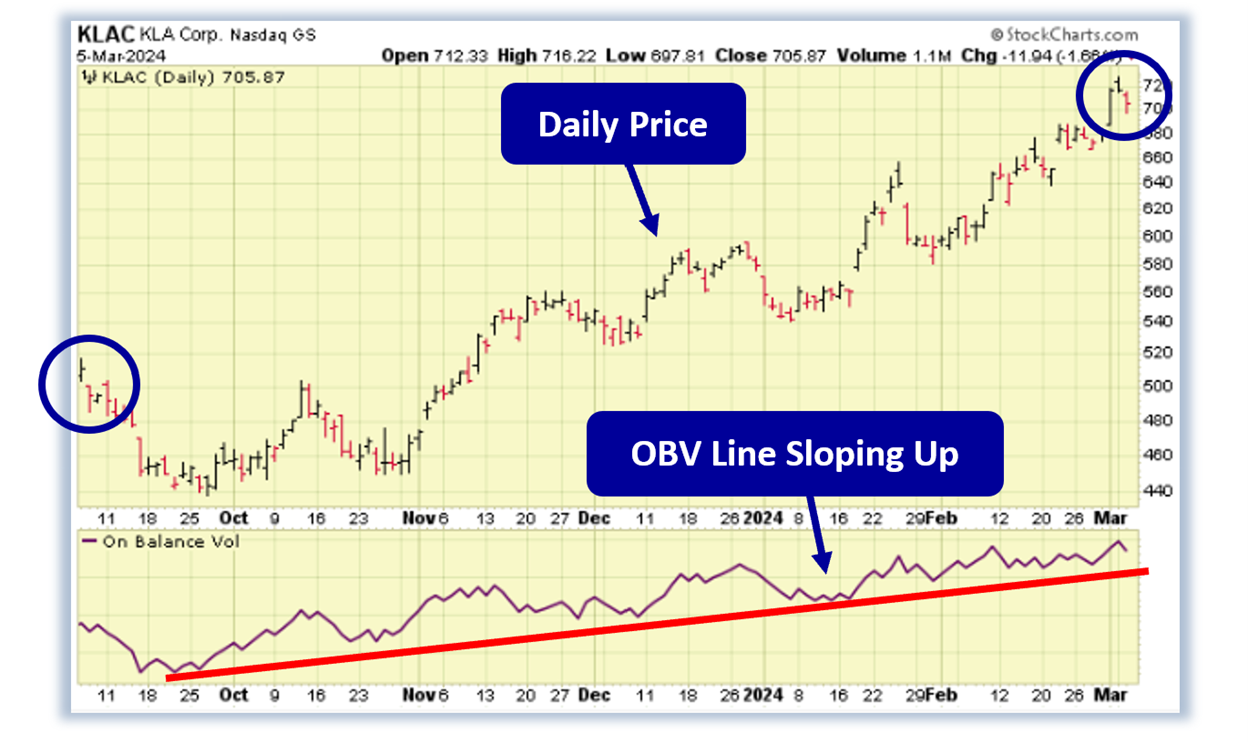
The KLAC daily price chart below shows that the stock is in a price uptrend as the recent price is above the price KLA Corp. traded at six months ago (circled). The On Balance Volume chart is below the daily chart.
On Balance Volume measures volume flow with a single easy-to-read line. Volume flow precedes price movement and helps sustain the price uptrend. When a stock closes up, volume is added to the line. When a stock closes down, volume is subtracted from the line. A cumulative total of these additions and subtractions form the OBV line.
On Balance Volume Indicator
- When Close is Up, Volume is Added
- When Close is Down, Volume is Subtracted
- A Cumulative Total of Additions and Subtractions form the OBV Line
Volume flow precedes price and is the key to measuring the validity and sustainability of a price trend.
We can see from the On Balance Volume chart below that the On Balance Volume line for KLA Corp. is sloping up. An up-sloping line indicates that the volume is heavier on up days and that buying pressure is exceeding selling pressure. Buying pressure must continue to exceed selling pressure in order to sustain a price uptrend.
So, On Balance Volume is a simple indicator to use that confirms the price uptrend and its sustainability. The numerical value of the On Balance Volume line is not important. We simply want to see an up-sloping line to confirm a price uptrend.
(Click on image to enlarge)
Confirmed ‘Buy’ Signal for KLA Corp.
Since KLA Corp.’s On Balance Volume line is sloping up, the most likely future price movement for the stock is up, making KLA Corp. a good candidate for a stock purchase or a call option spread.
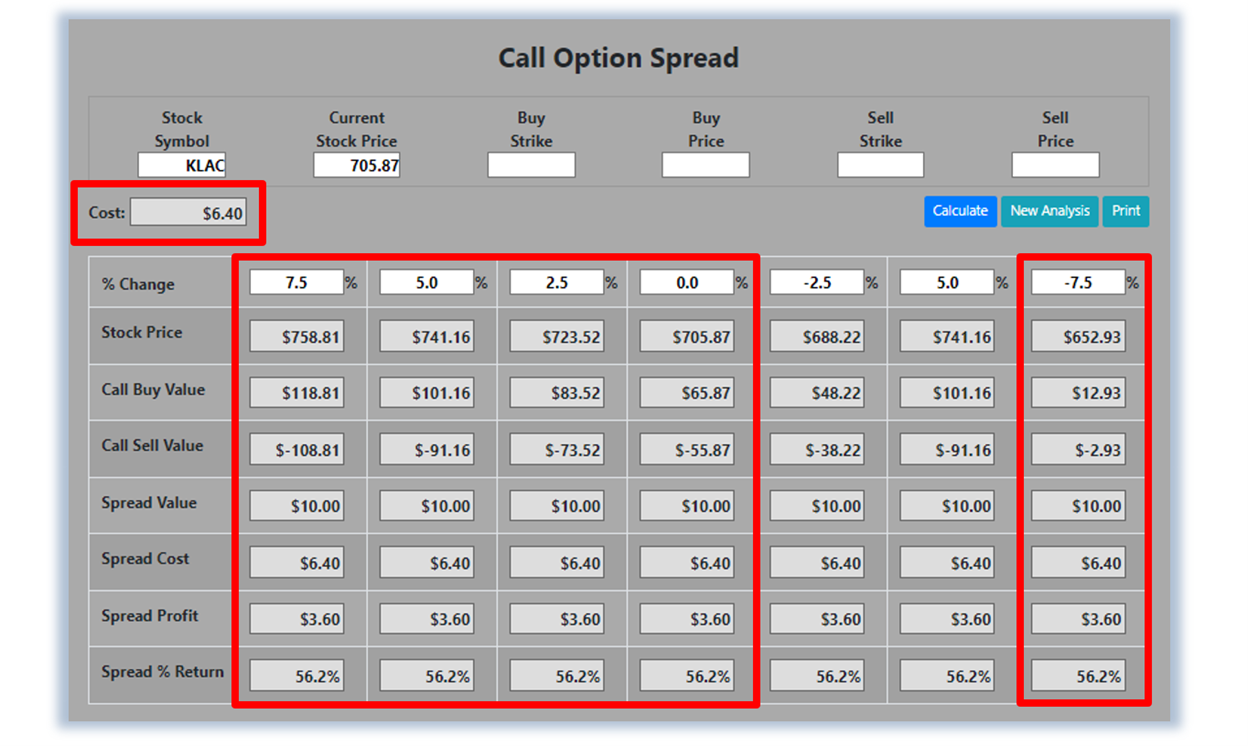
Let’s use the Hughes Optioneering calculator to look at the potential returns for a KLA Corp. debit spread. The Call Option Spread Calculator will calculate the profit/loss potential for a call option spread based on the price change of the underlying stock/ETF at option expiration -- in this example, from a 7.5% increase to a 7.5% decrease in KLA Corp. stock at option expiration.
The goal of this example is to demonstrate the ‘built in’ profit potential for option spreads and the ability of spreads to profit if the underlying stock is up, down, or flat at option expiration.
Out of fairness to our paid option service subscribers, we don’t list the option strike prices used in the profit/loss calculation. The prices and returns represented below were calculated based on the current stock and option pricing for KLA Corp. stock on March 5, 2024 before commissions.
Built in Profit Potential
For this option spread, the calculator analysis below reveals the cost of the spread is $640 (circled). The maximum risk for an option spread is the cost of the spread. The analysis reveals that if KLA Corp. stock is flat or up at all at expiration, the spread will realize a 56.2% return (circled). And if KLA Corp. stock decreases 7.5% at option expiration, the option spread would make a 56.2% return (circled).
Due to option pricing characteristics, this option spread has a ‘built in’ 56.2% profit potential when the trade was identified. Option spread trades can result in a higher percentage of winning trades compared to a directional option trade if you can profit when the underlying stock/ETF is up, down, or flat. A higher percentage of winning trades can give you the discipline needed to become a successful trader.
(Click on image to enlarge)
About the Author
Chuck Hughes started his trading career with a $4,600 trading account and made $460,164 in profits his first two years of trading. These profits were more than he's made the previous six years as an airline pilot.
Mr. Hughes is a seven-time winner of the World Trading Championship and has more wins than any other trader in the history of the competition. The World Trading Championship is a real money trading contest and results are audited by CPAs before being posted on the sponsor's website. He took second place in the contest last year with a real time 339% annual return.
The Hughes Optioneering stock and option strategies have produced over $7.2 million in actual profits over the past eight years, which are documented in the Guaranteed Real Optioneering Winners book.
More By This Author:
Healthy Rotation, Surging Earnings Make This Market Different Than 2000
MDB: A High-Flying Software Stock Likely To Report Strong Earnings
Berkshire Hathaway, Apple, And "Cigar Butt" Investing: An Investor Tale


Comments
Log in or sign up to join the conversation.