JNJ Should Rally Soon Or See 3 Swings Higher At Least
Johnson & Johnson (JNJ) is an American multinational corporation founded in 1886 that develops medical devices, pharmaceuticals, and consumer packaged goods. Its common stock is a component of the Dow Jones Industrial Average, and the company is ranked No. 36 on the 2021 Fortune 500 list of the largest United States corporations by total revenue.
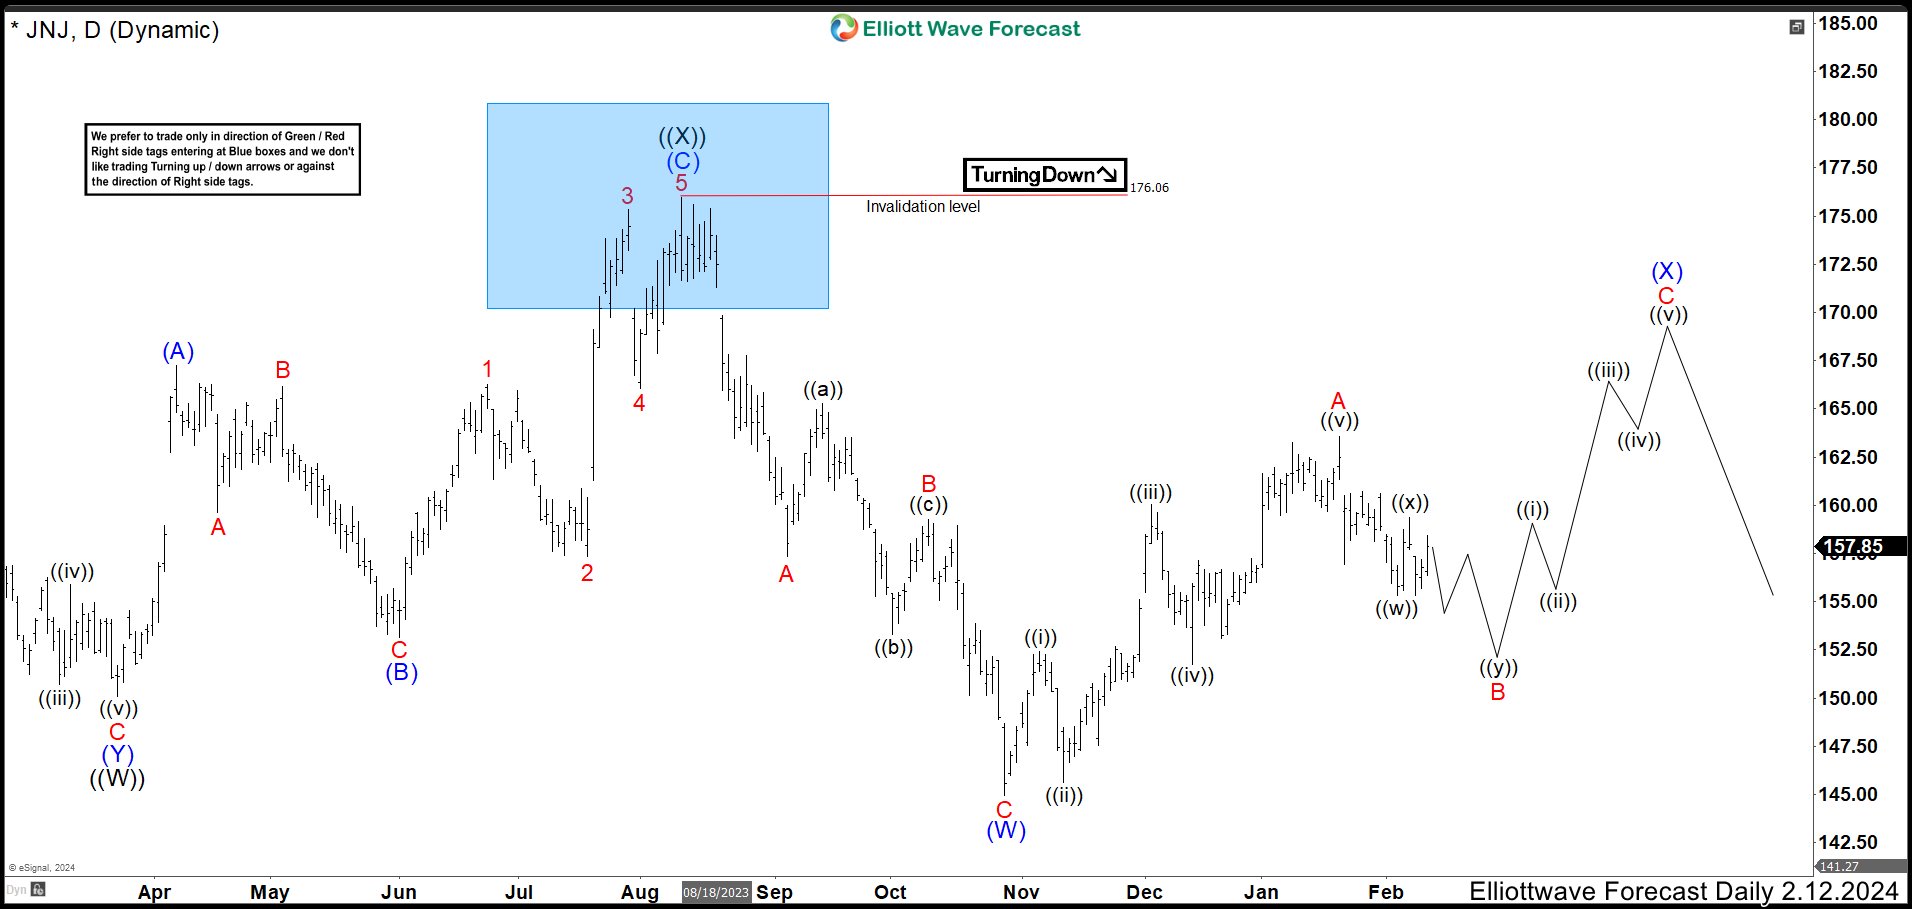
JNJ Daily Chart February 2024
(Click on image to enlarge)
In the last analysis, we called 3 waves more to the downside to end a double correction structure ((W)), ((X)), ((Y)). The stock reacted lower from a blue box area ending wave ((X)) and starting wave ((Y)). First leg of wave ((Y)) did 3 swings, with a wave B as a flat correction, ending wave (W) at 144.95 low. Then, we were looking for 3 swings higher to fail below 175.97 high to complete wave (X) before seeing lower prices.
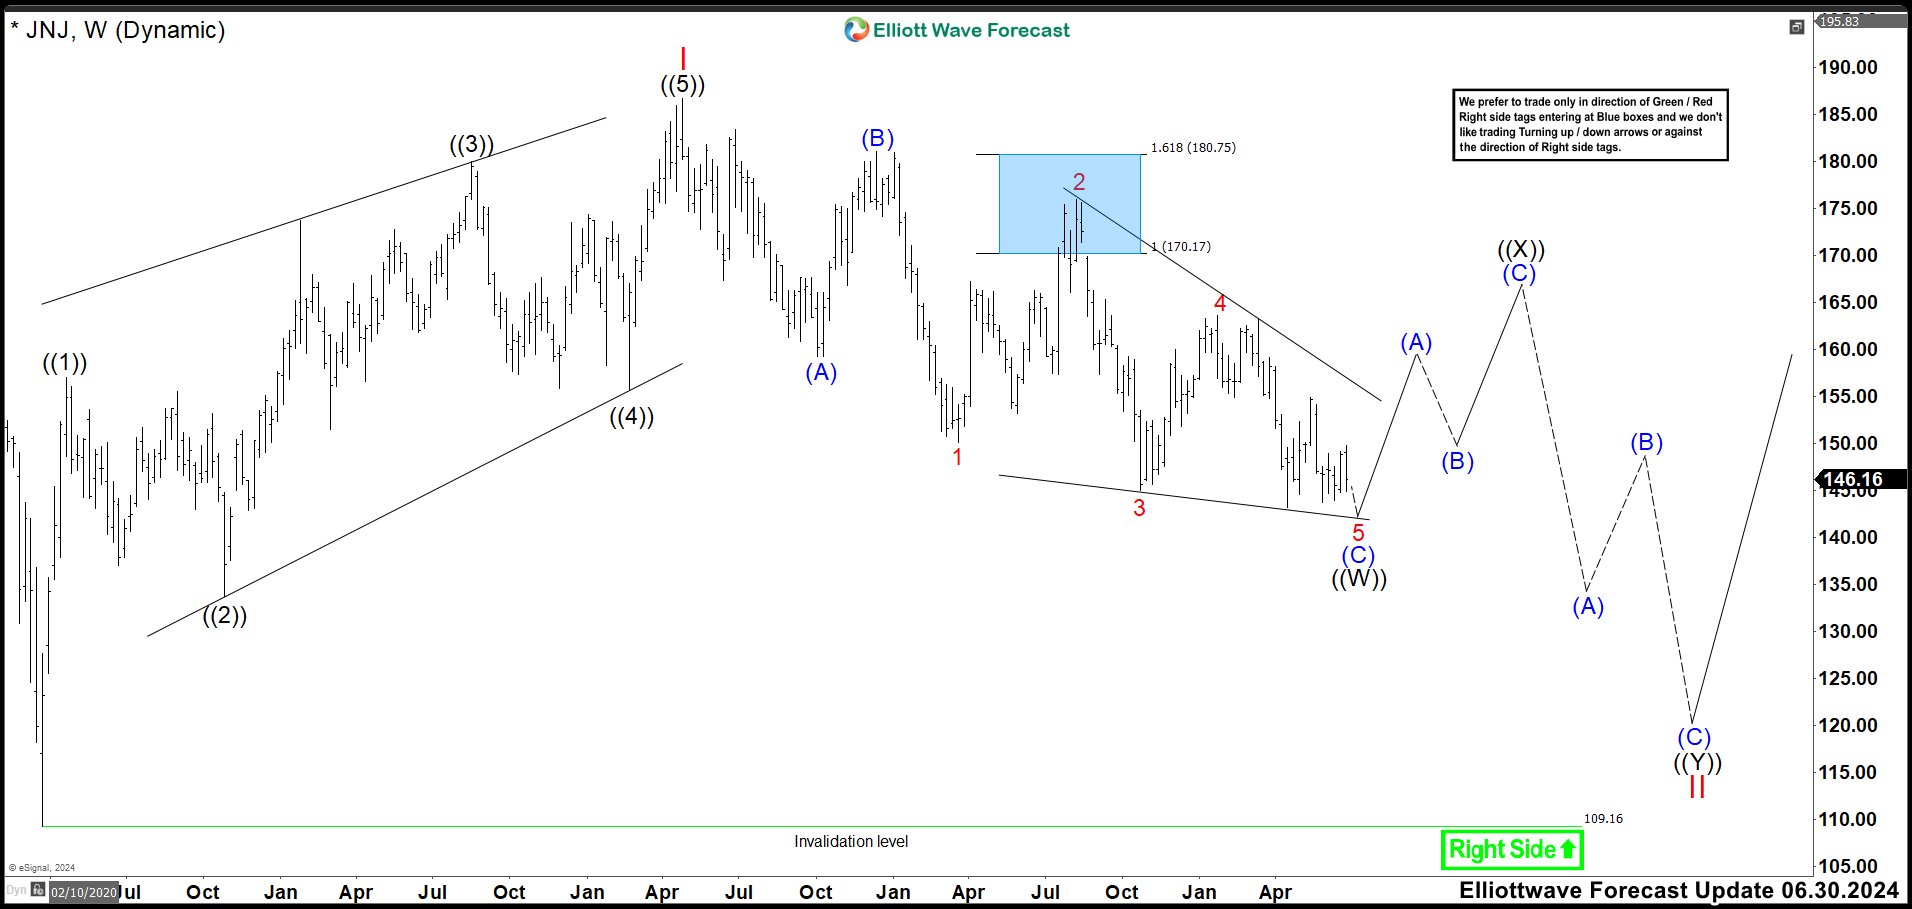
JNJ Weekly Chart June 2024
(Click on image to enlarge)
In the Weekly chart above, we have adjusted the labelling of the structure from 186.69 high. Down from the peak. We are labeling a flat correction as wave ((W)) where wave (C) is an ending diagonal. Wave (A) ended at 159.17 low in Oct 2022 and wave (B) rally finished at 181.04 high. Then, the structure looked like as a double correction because we have a lot of waves traslaped. However, the momentum lower has slowed down, suggesting that JNJ could be ready for a rally and the ending structure as wave (C) is the best option for this.
The double correction is still possible that plays out, but for that, the market needs to drop to 134.40 – 132.50 area and see a strong bounce from there. In that scenario the structure would be a double correction instead (A), (B), (C). Either way, the trade from the blue box should end soon because JNJ could rally in 3 swings at least.
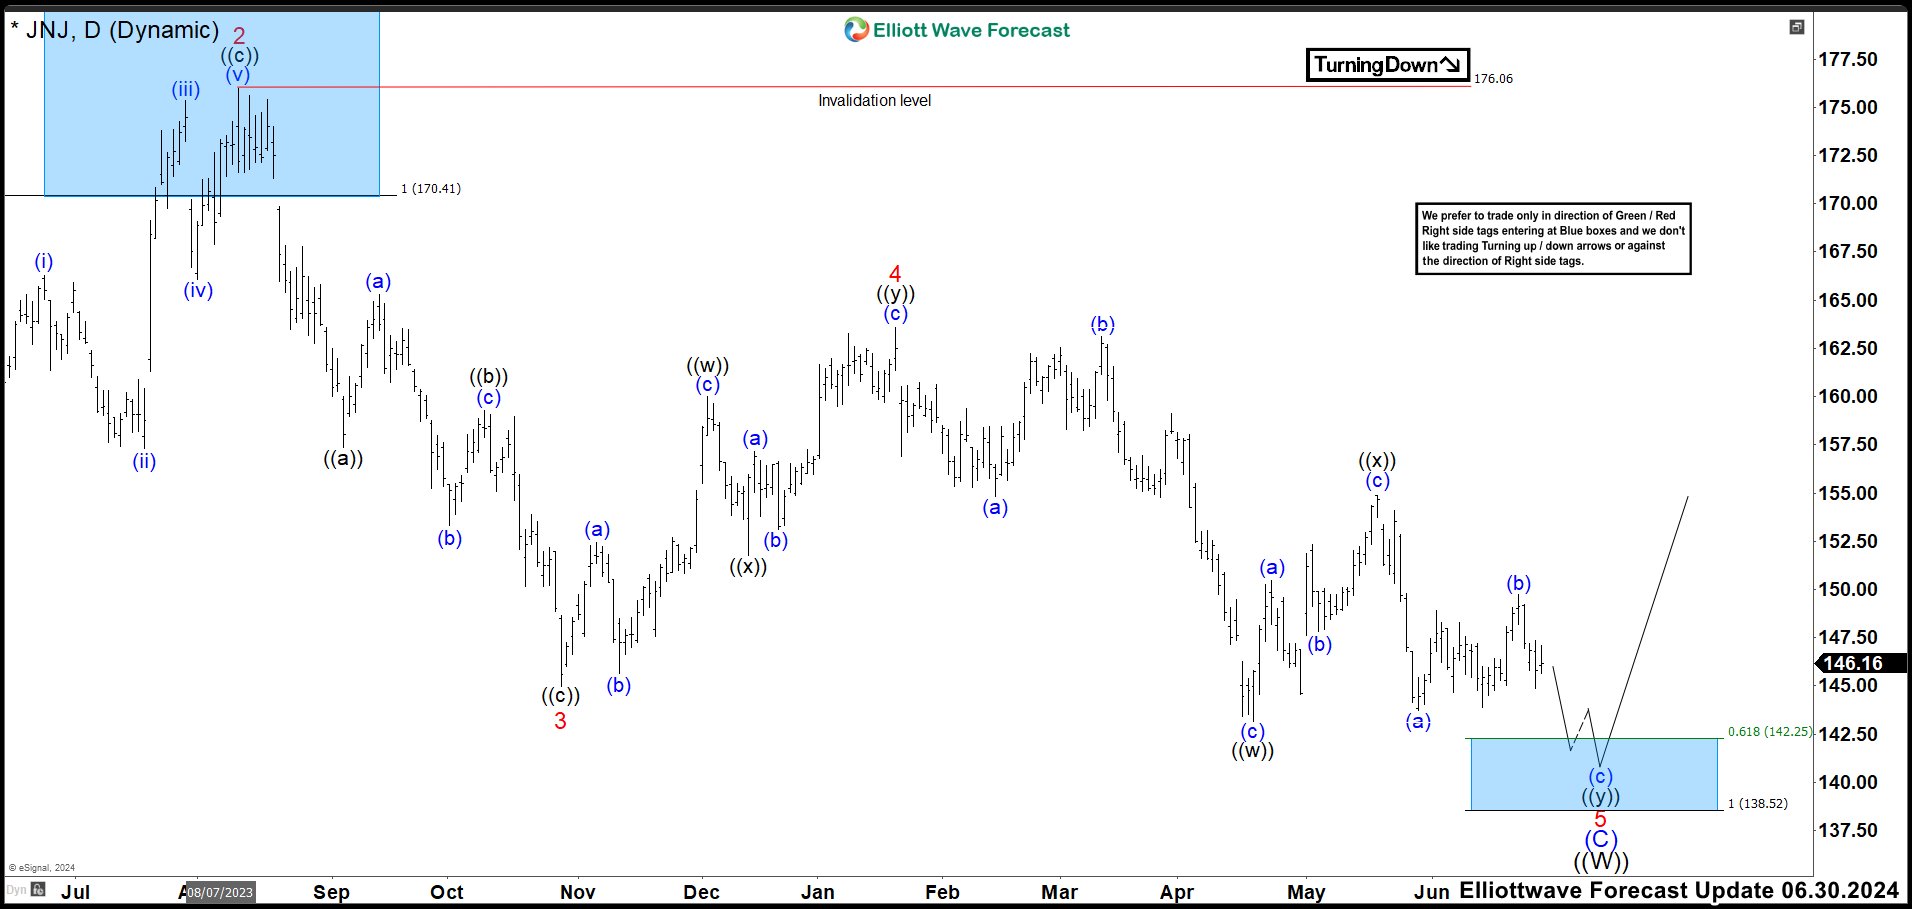
JNJ Daily Chart June 2024
(Click on image to enlarge)
With a new Daily chart of JNJ, the market didn’t have the strengh to break the old wave A high (now wave 4) and resumed lower favoring our trade from the blue box. The price action broke below 144.95 wave 3 low, suggesting we are currently trading in wave 5 of (C). It is possible that wave 5 could be ended at 143.13 wave ((w)) low. However, the structure does not help too much and we are calling one more slighly low to end wave 5 of (C) and also wave ((W)).
If everything results as we expect, JNJ should end wave ((W)) structure in 142. 25 – 138.52 area where we have to close our trade from the blue box. Even if market could drop more as we said before to build a double correction, it is better to closed it in the area we mencioned and wait for a rally.
More By This Author:
Vertiv Holdings Should Pullback Before Rally ResumesEURUSD : 1:7 Risk/Reward Target Hit
Netflix Stock Buying The Dips At The Blue Box Area
Disclaimer: Futures, options, and over the counter foreign exchange products may involve substantial risk and may not be suitable for all investors. Leverage can work against you as well as for ...
more


