
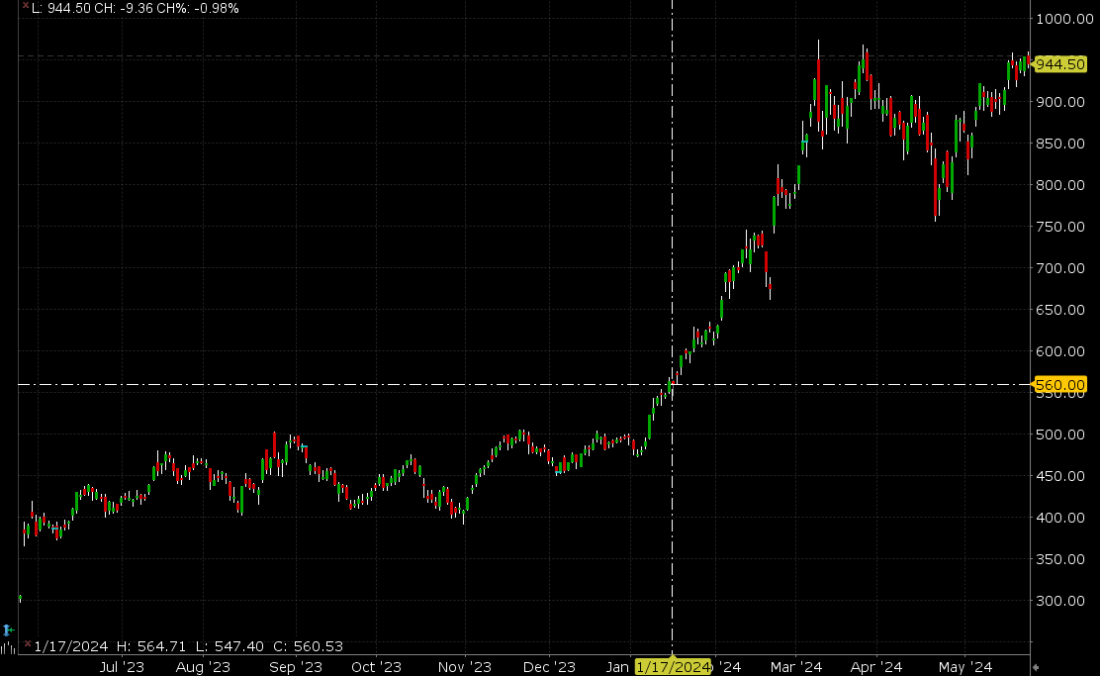
On January 17th of this year, when Nvidia (NVDA) was beginning the latest, most significant leg of its utterly spectacular run, we wrote a piece entitled, “It’s NVDA and Everything Else”. At that time the stock was a “mere” $560.Since then, the stock is up about 70% in just over four months, and I will assert that it has taken much of the broader market along for an upward rise. I don’t think it is at all hyperbolic to suggest that there is a whole lot riding on today’s report. It’s something we asserted ahead of last quarter’s earnings, and with the stock up about 40% since then, it seems as relevant – if not more – today.
NVDA 1-Year, Daily Candles, with January 17th levels highlighted
(Click on image to enlarge)
Source: Interactive Brokers
Indeed, last quarter’s earnings were the latest in a remarkable run of beating expectations, raising guidance, then beating the raised guidance and raising it once again. This is clearly what the market believes can and should happen once again. Consensus estimates are for adjusted earnings of $5.60 per share on revenues of $24.59 billion. For perspective, year-ago EPS was $0.92 on revenues of $7.19 billion. That means that the company is expected to show over fivefold EPS growth on more than triple the sales. That is truly phenomenal.No wonder why this is a market darling. It plainly deserves it!
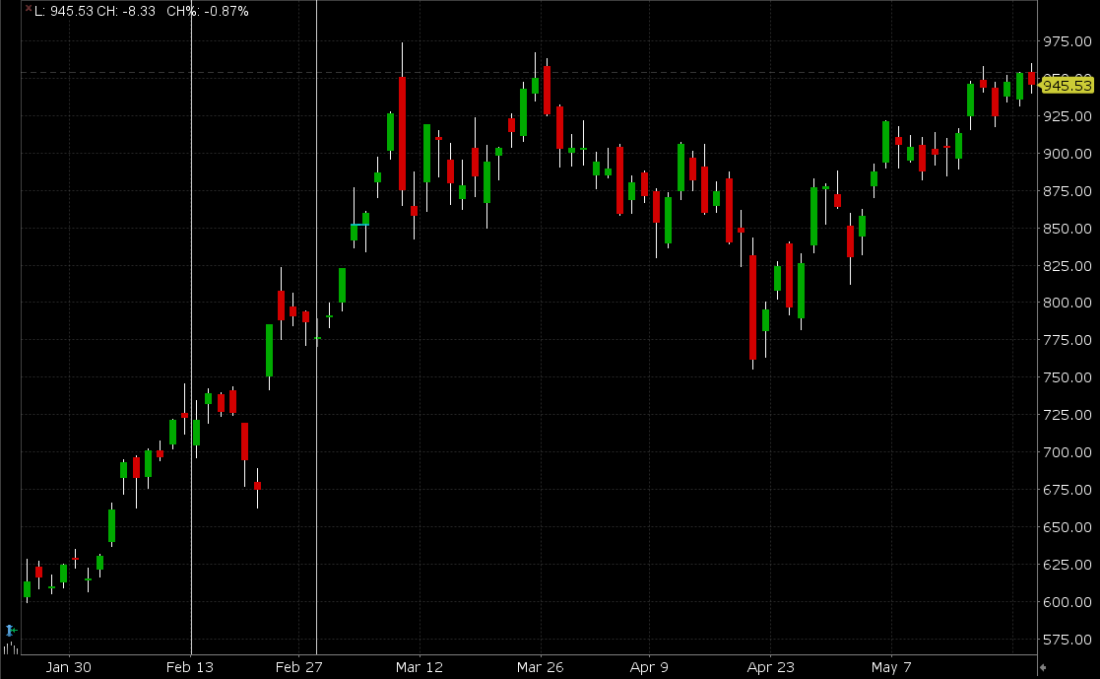
Yet there is a different setup coming into today’s earnings report. Note the period between the two vertical lines in the chart below. We can see that NVDA saw some profit-taking that led to a 10% decline in the sessions leading up to the release. The 16% post-earnings jump is really just a resumption of the steep uptrend after a brief hiccup. Now look at the current portion of the chart. We see the stock grinding higher.
NVDA 4-Months Daily Candles
(Click on image to enlarge)
Source: Interactive Brokers
Thus, not only are we approaching earnings at a significantly higher plateau than last quarter, but investors also have a very different view of risk this time. Instead of some modest risk aversion, it appears much more as though investors are primed for yet another breakout.
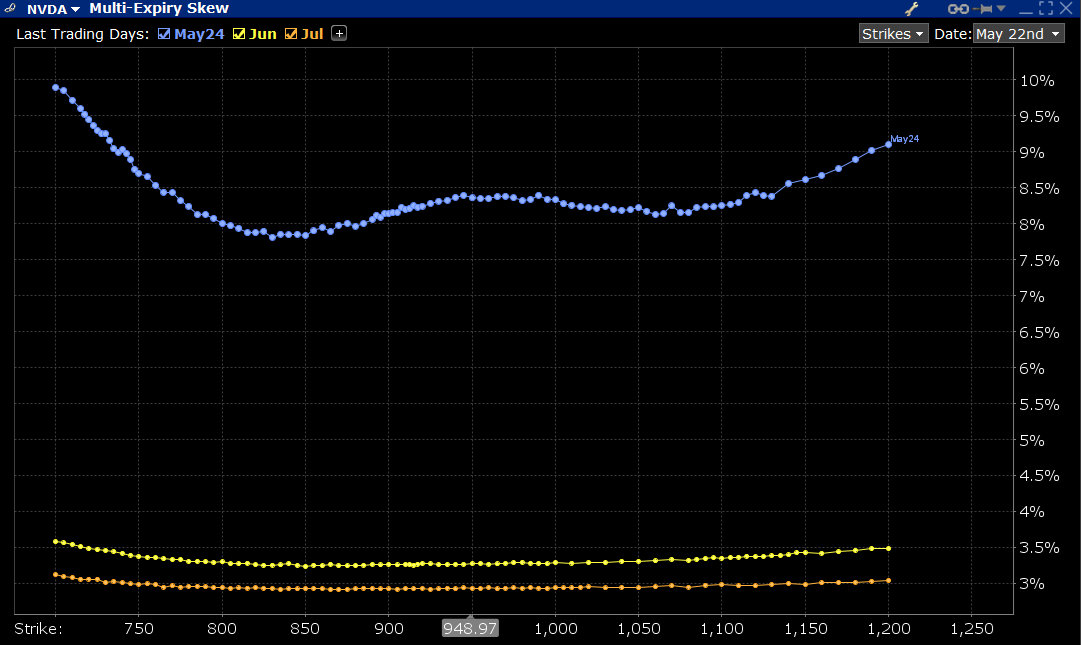
The skew chart below demonstrates how many traders are continuing to use options as “FOMO Insurance.”It is understandable why some investors would rather buy call options, which have a defined cash outlay, rather than a high-priced stock as a means to avoid missing further upside. While we see a bit of a bump in the implied volatilities of near-money options, particularly in the near upside $950-1000 region, we see dips a bit below and above market. The latter is normal, the former is not. Nor is the general flatness of the curve. These all show that options traders are not particularly risk averse, and in fact place a relatively high probability on an upside move:
NVDA Skew for Options Expiring May 24th (blue), June 21st (yellow), July 19th (orange)
(Click on image to enlarge)
Source: Interactive Brokers
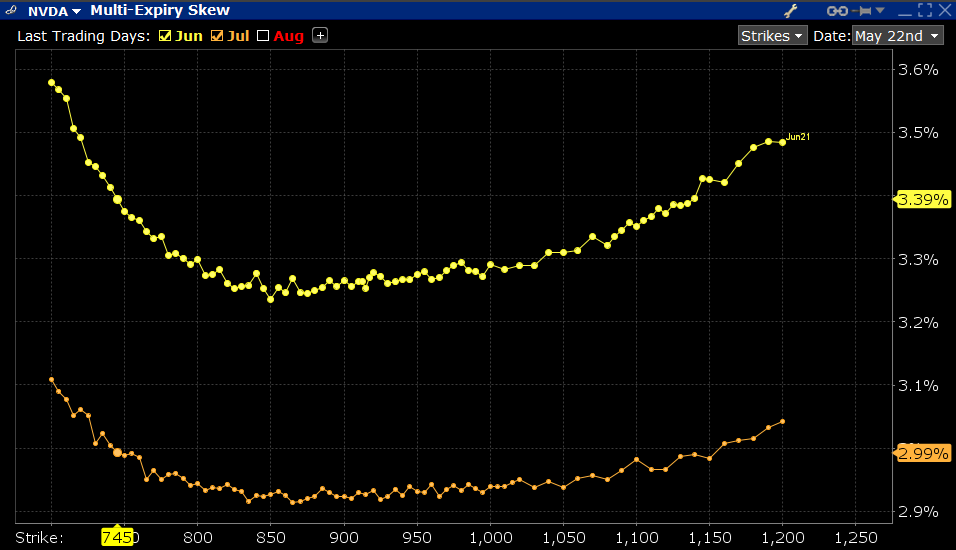
By the way, although the next two monthly expirations, displayed on the chart above, appear to be relatively normal, those too show relative complacency about a down move and enthusiasm for an upward move. The curves simply look flat because of the above chart’s scale. Note that the low points are once again below the current price:
NVDA Skew for Options Expiring June 21st (yellow), July 19th (orange)
(Click on image to enlarge)
Source: Interactive Brokers
Importantly, when we look at the at-money implied volatility for options expiring this week, we see that it is about 8.5% on a daily basis. Considering that the stock’s last five post-earnings moves were +16.4%, -2.46%, +0.10%, +24.37%, and +14.02%, it’s understandable why traders would be betting on upside. But it’s not clear why 8.5% is the prevailing implied vol when those average to a robust 11.47%. Interestingly, that was much closer to the implied volatility level that prevailed ahead of last quarter’s earnings. Also quite interestingly, and quite presciently, I might add, we saw upside volatilities explode on the final day of trading ahead of earnings. So far today we have not yet seen that.
NVDA Options Skew for Options Expiring May 24th as of today (white) and Options Expiring February 23rd as of Feb 20th (green) and Feb 21st (red)
(Click on image to enlarge)
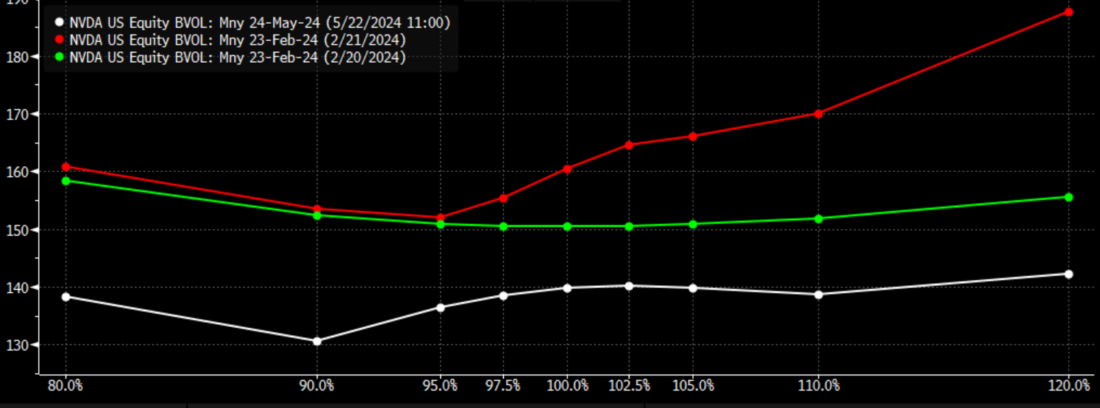
Source: Bloomberg
While we harp on the lack of risk aversion displayed by options positioning, the IBKR Probability Lab offers some solace to those who are afraid that traders are simply too bullish. Although the curve is hardly a symmetric bell, it shows peak probabilities around $900, or about 5% below current levels.
IBKR Probability Lab for Options Expiring May 24th
(Click on image to enlarge)
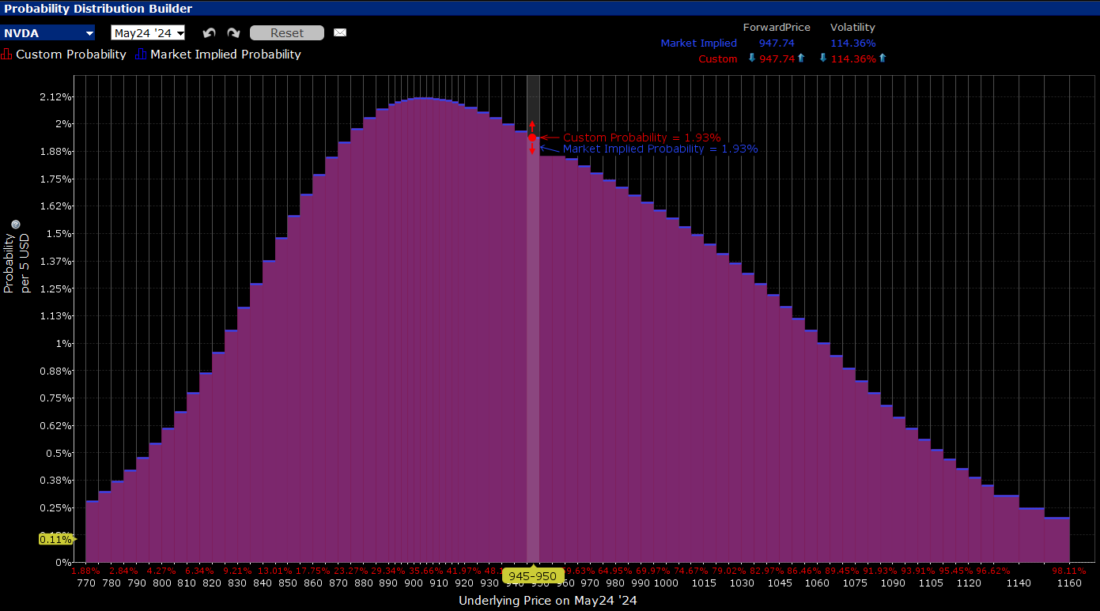
Source: Interactive Brokers
In just a few hours we’ll know the outcome. As we wrote last week:
[The level of enthusiasm for all things AI-related] of course raises the stakes for Nvidia’s (NVDA) earnings report next week. If they can continue their enviable, remarkable string of beating estimates, raising guidance, then beating the raised guidance next quarter, that means that the AI trade can and will proceed apace. If there is even the slightest sign of weakness, however, much more than that stock alone will suffer.
If today’s report from NVDA brings good news, then we might be off to the races once again. If not, buckle up. No pressure, Mr. Huang…
More By This Author:
Why Did VIX Close At Long-Term Lows Last Week?Not With A Bang But A Whimper
Everything Is AI Play – Copper And Utilities Edition


Comments
Log in or sign up to join the conversation.