

Image Source: Unsplash
Yesterday I made an offhanded comment to someone that the market had become Nvidia (NVDA) and everything else. The statement was intended as flippant and hyperbolic, but it turns out to have a reasonable basis in practice – at least over the past few days.
At that point in the afternoon, the NASDAQ 100 (NDX) and the NASDAQ Composite (COMP) indices were essentially unchanged despite a significant majority of the stocks on that exchange trading lower. On yesterday’s session, NDX closed -0.01% lower and COMP closed -0.19% lower even as declining stocks outpaced advancers by a 3,143 to 1,159 margin. At the same time, NVDA closed +3.06% for yet another record high – it’s fourth in six sessions. Even though NDX has not surpassed the record high that it set three weeks ago, it’s certainly not NVDA’s fault – the stock is up over 13% year-to-date!
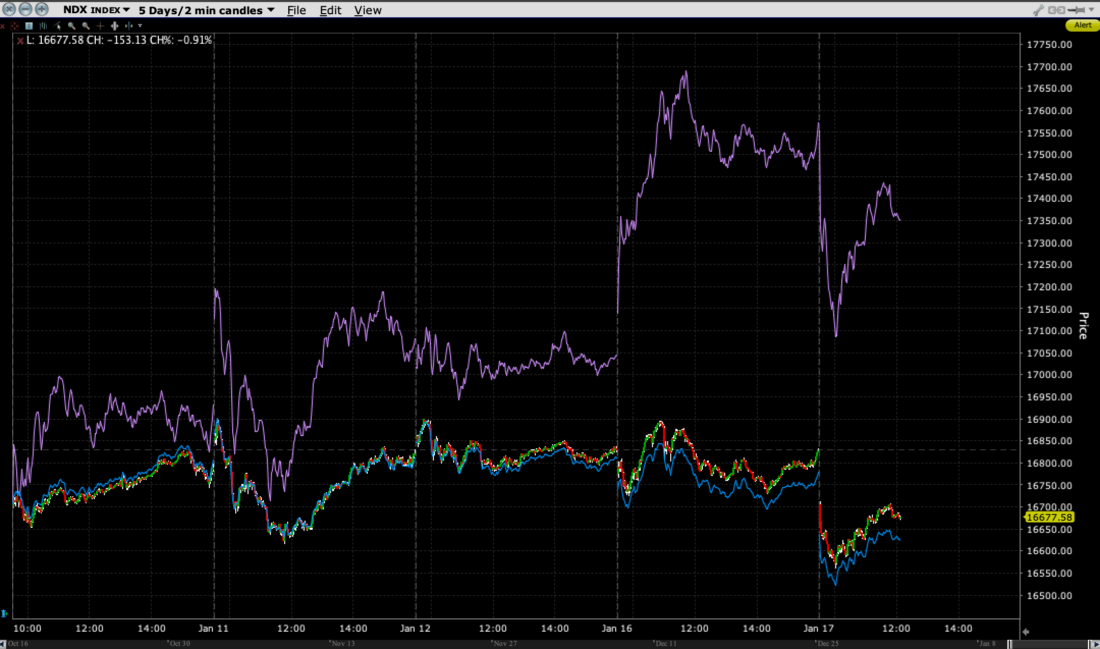
Yet the following chart shows that over the past five days, NVDA has exerted something of a gravitational pull on NDX and COMP:
5-Day Chart, NDX (2-Minute, red/green candles), COMP (blue line), NVDA (purple line)
(Click on image to enlarge)
Source: Interactive Brokers
There are a couple of things to note in the graph. First is how much more volatile NVDA is than NDX. That of course stands to reason. An individual stock should be more volatile than an index that contains it.However, it is clear that the general intraday patterns for the indices roughly follow that of NVDA, despite the fact that NVDA only represents just over 4% of NDX. It’s psychological impact upon the indices far outweighs its expected impact.
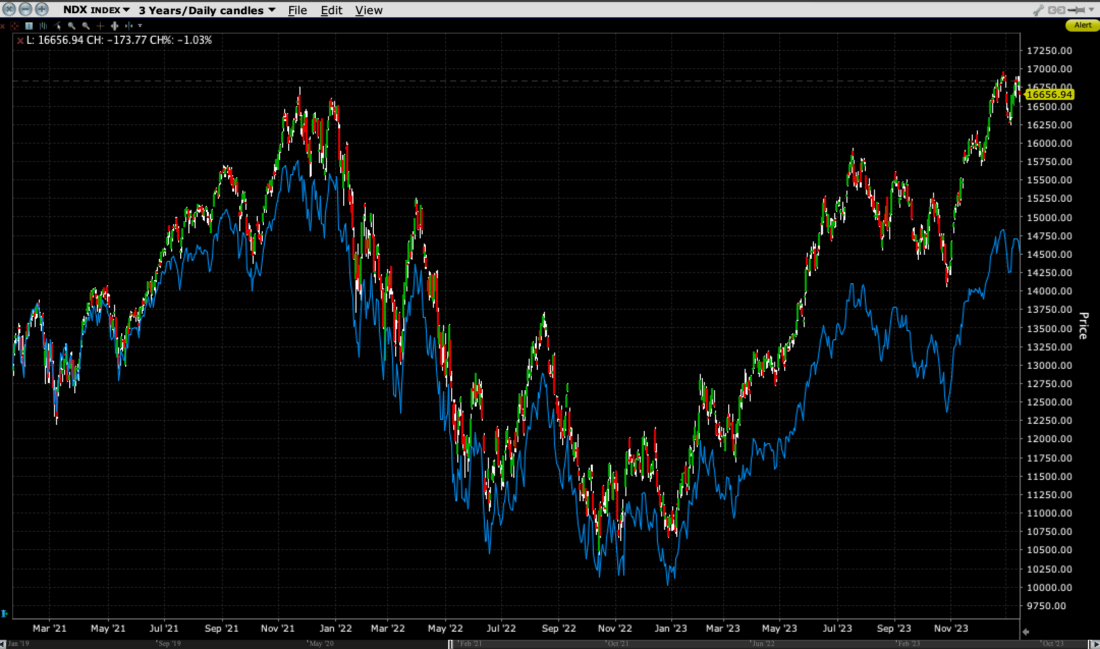
The second thing to note is the continued tight relationship between COMP and NDX. That’s a matter of weighting. The stocks in NDX have a very heavy weight in COMP, while the top 10 stocks in NDX represent about 40% of that index. Yet it is apparent that that NDX has slightly outperformed COMP over the brief time period shown above. When we look at the comparison between those two indices on a long-term basis, the recent outperformance of NDX is readily apparent:
3-Year Chart, NDX (red/green candles), COMP (blue line)
(Click on image to enlarge)
Source: Interactive Brokers
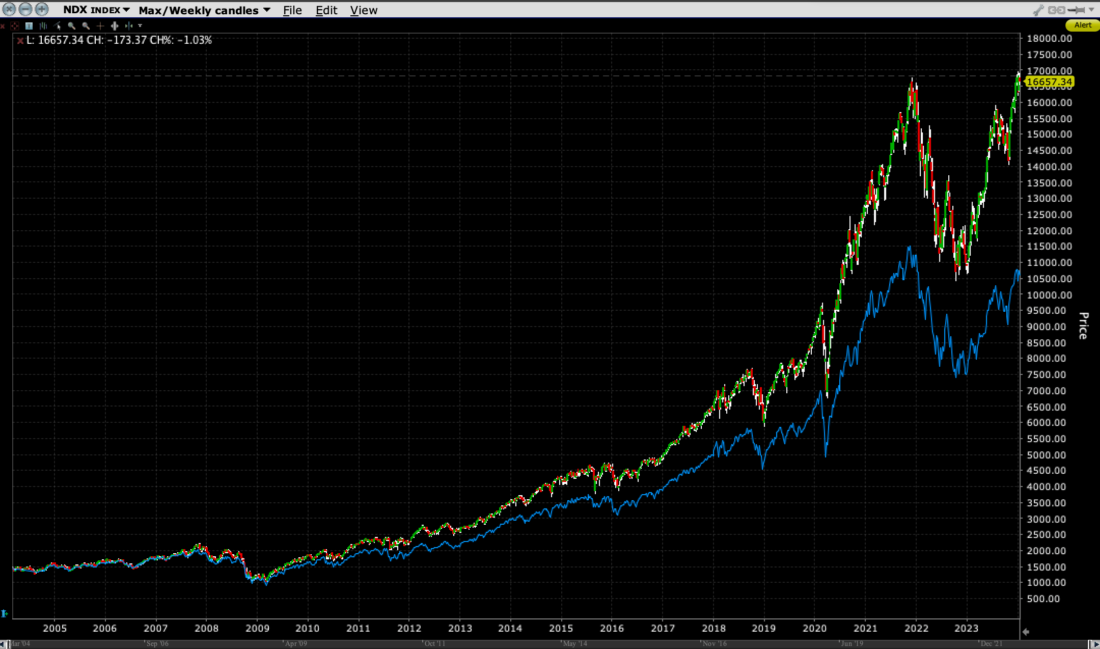
20-Year Chart, NDX (red/green candles), COMP (blue line)
(Click on image to enlarge)
Source: Interactive Brokers
It is evident that since markets emerged from the Global Financial Crisis in 2009, NDX has been steadily outpacing COMP. The explanation is not particularly difficult. The low interest rate environment that has prevailed since then has favored growth stocks over value stocks while we have also seen the market’s leading technology stocks solidify their dominance. While this concept was reinforced in the post-Covid era, it is useful to note that the spread between the two indices has never been wider.
One might be tempted to think that two indices that correlate so closely (R-squared values over the past 20 years have ranged between 0.97 and 0.985)would inevitably experience some mean reversion.I don’t doubt that could be the case, but if one were willing to put on a trade to that effect, there are important risk management considerations. Importantly, just because things can, and maybe should, revert to their long term averages, there is no reason to expect that they actually will. Heck, you could have put on this trade two months ago on this basis, only to see the spread widen. A trade that would involve favoring COMP over NDX would need a solid rationale. Perhaps an opinion that the market’s love of big-cap technology is overblown, or that a more lasting shift from growth to value is underway. Neither opinion is truly implausible. But as long as NDX remains a captive of NVDA, that type of trade requires tight stops and risk discipline.
More By This Author:
Clues To Solving The Markets’ Key Contradiction
Investors Only Care About Data That Buoys The Rate Cut Narrative
Welcome To “Head Fake Thursday”


Comments
Log in or sign up to join the conversation.