It's Crunch Time: An Update On Alibaba's Freefall

Photo: Andy Mitchell, Flickr
Alibaba Group Ltd. BABA shares are trading lower Friday in sympathy with DiDi Global Inc. DIDI after the company announced plans to delist from the New York Stock Exchange. Alibaba also trades lower as COVID-19 variant omicron is hurting many retail stocks.
Alibaba was down 7.7% at $112.60 at press time.
Alibaba Daily Chart Analysis
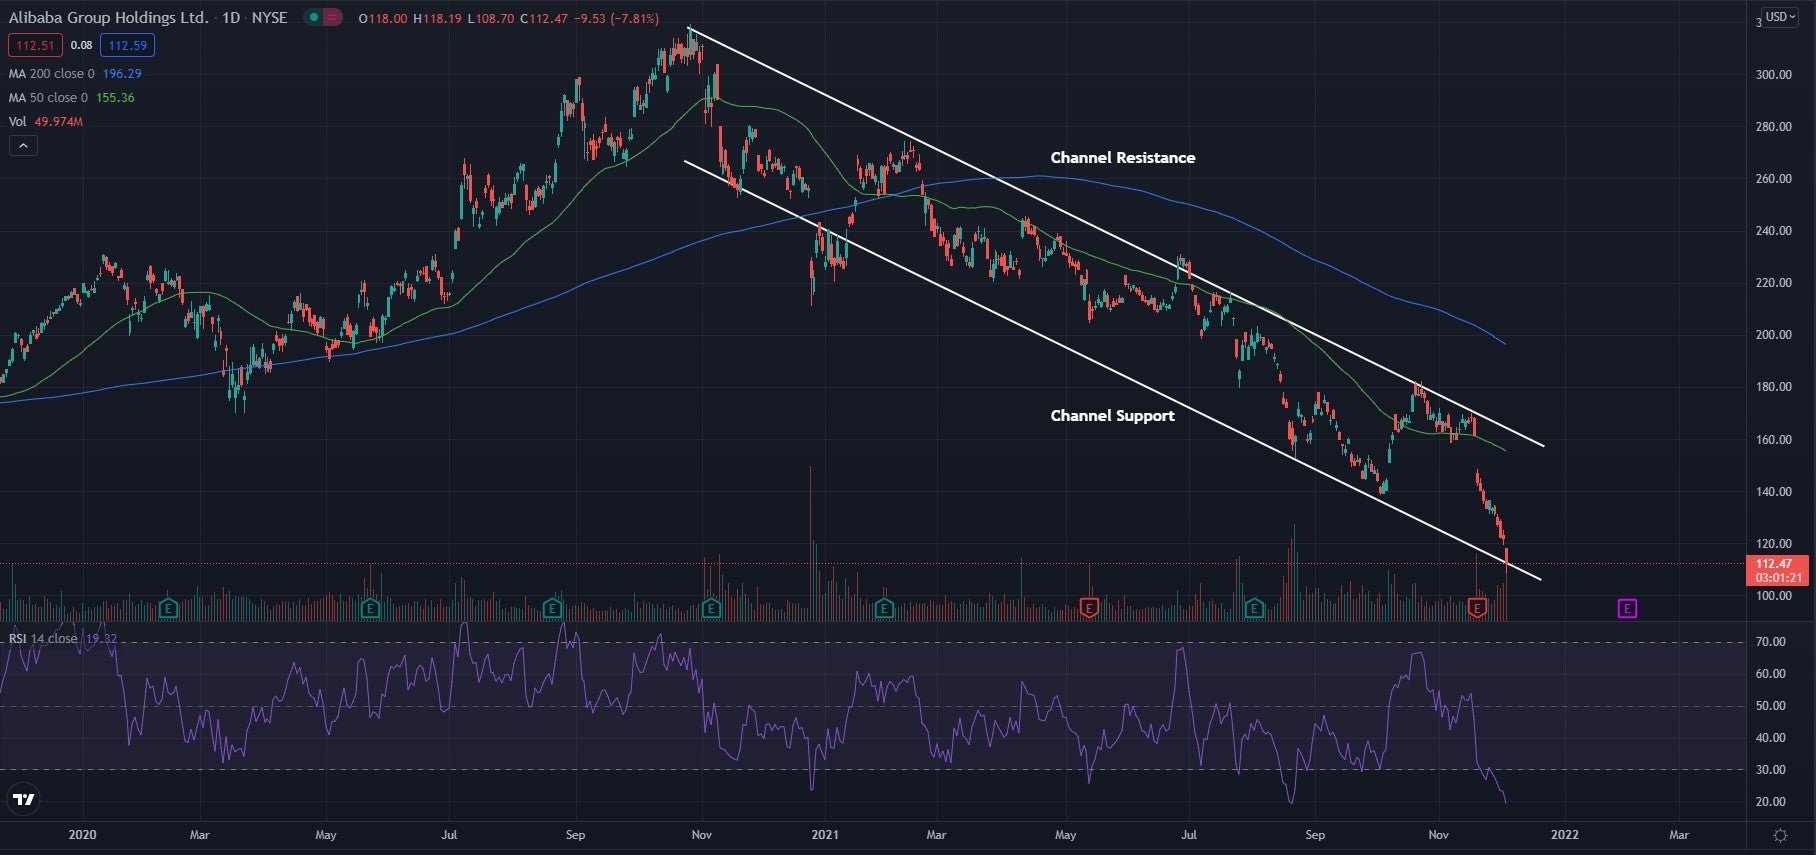
- The stock fell to the bottom of what technical traders call a downward trending channel.
- Connecting the highs and lows shows the downtrend the stock has been in as it continues to drop. The stock is at a key point in this channel where it will either bounce off the channel support or see a break below the channel support.
- The stock trades below both the 50-day moving average (green) and the 200-day moving average (blue), indicating the stock’s sentiment has been bearish.
- Each of these moving averages may hold as an area of resistance in the future.
- The Relative Strength Index (RSI) continues to remain in a freefall and now sits at 19, well into the oversold range. This shows that sellers continue to enter the market on the stock and that selling pressure heavily outweighs the buying pressure.
(Click on image to enlarge)

What’s Next For Alibaba?
Bullish traders are hoping the stock will bounce off channel support and begin to push back higher once again. Bulls are then hoping the stock will be able to eventually break above resistance in the channel to signal that the downtrend has been broken.
Bearish traders are hoping the stock can fall below the channel support. Falling below channel support may bring about a further bearish push and put the stock into a freefall for a time. Bears are looking to see the stock continue to trade below the moving averages, this may keep bearish sentiment in the stock.
© 2021 Benzinga.com. Benzinga does not provide investment advice. All rights reserved.


