Tuesday, August 17, 2021 3:44 AM EST
At the close of trading yesterday (8/16/2021) the S&P 500 Index is up 100.22% on a price-only basis from its March 23, 2020 low of 2,237.40. It took the market 353 trading days to reach this feat or just short of a year and a half.
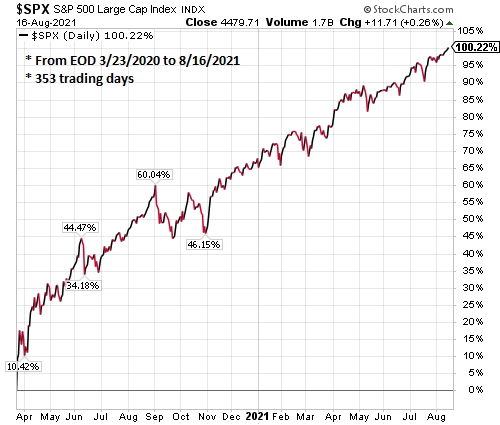
As the chart shows, except for some volatility around the U.S. election in November of last year, the market has been on a steady move higher. This year through August 16, the S&P 500 Index is up 19.27%. Certainly, some consolidation of the returns achieved since the pandemic low last year would be healthy and expected. On the other hand, as noted in my post at the end of July, A Stealth Equity Market Correction, under the surface of the market a correction seems to have occurred.
Disclaimer: The information and content should not be construed as a recommendation to invest or trade in any type of security. Neither the information nor any opinion expressed constitutes a ...
more
Disclaimer: The information and content should not be construed as a recommendation to invest or trade in any type of security. Neither the information nor any opinion expressed constitutes a solicitation to the purchase or the sale of any security or investment of any kind.
The Content of This Site Is for Informational Purposes Only. The Blog of Horan Capital Advisors and Horan Capital Advisors (HCA) Disclaim Responsibility for Updating Information on This Site. In Addition, the Blog of Horan Capital Advisors and HCA disclaim Any Responsibility for Third-party Content, Including Information Accessed Through Hyperlinks. All Individuals Are Advised to Conduct Their Own Independent Research Before Making Any Investment Decision. Past Performance Is Not Indicative of Future Results.
HORAN Capital Advisors, LLC is an SEC registered investment advisor. The information herein has been obtained from sources believed to be reliable but we cannot assure its accuracy or completeness. Neither the information nor any opinion expressed constitutes a solicitation for the purchase or sale of any security. Any reference to past performance is not to be implied or construed as a guarantee of future results. Market conditions can vary widely over time and there is always the potential of losing money when investing in securities. HCA and its affiliates do not provide tax, legal or accounting advice. This material has been prepared for informational purposes only and is not intended to provide and should not be relied on for tax, legal or accounting advice. You should consult your own tax, legal and accounting advisors before engaging in any transaction.
less
How did you like this article? Let us know so we can better customize your reading experience.


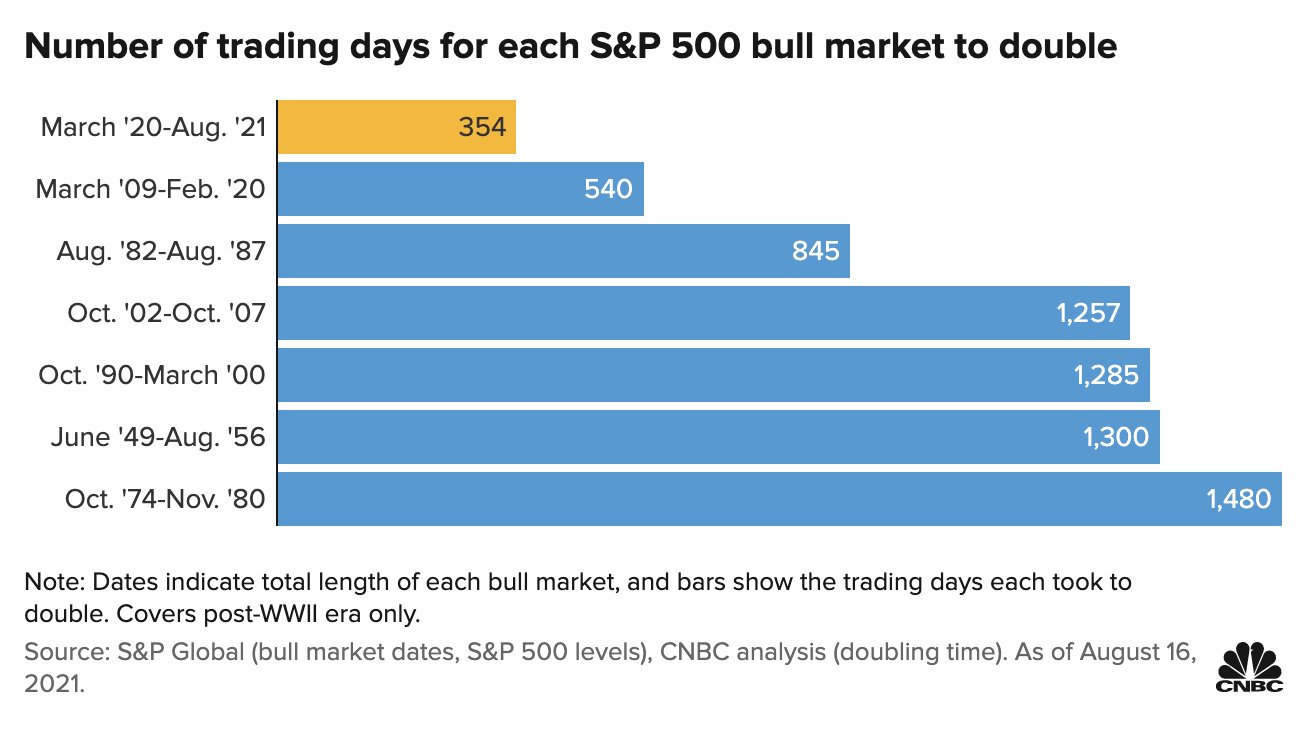
And the fastest doubling on record. https://twitter.com/jsblokland/status/1427557836414980097?s=21
Wow, thanks for sharing. For those too lazy to click, you can see the chart below: