Is The Nasdaq 100 Repeating Bearish Topping Pattern?
Image Source: Unsplash
Large cap technology stocks carry a significant amount of influence on the Nasdaq 100 and broader stock market indices.
Not only do many popular tech stocks carry out-sized market caps that sway the cap weighted indices, but the also factor into market sentiment.
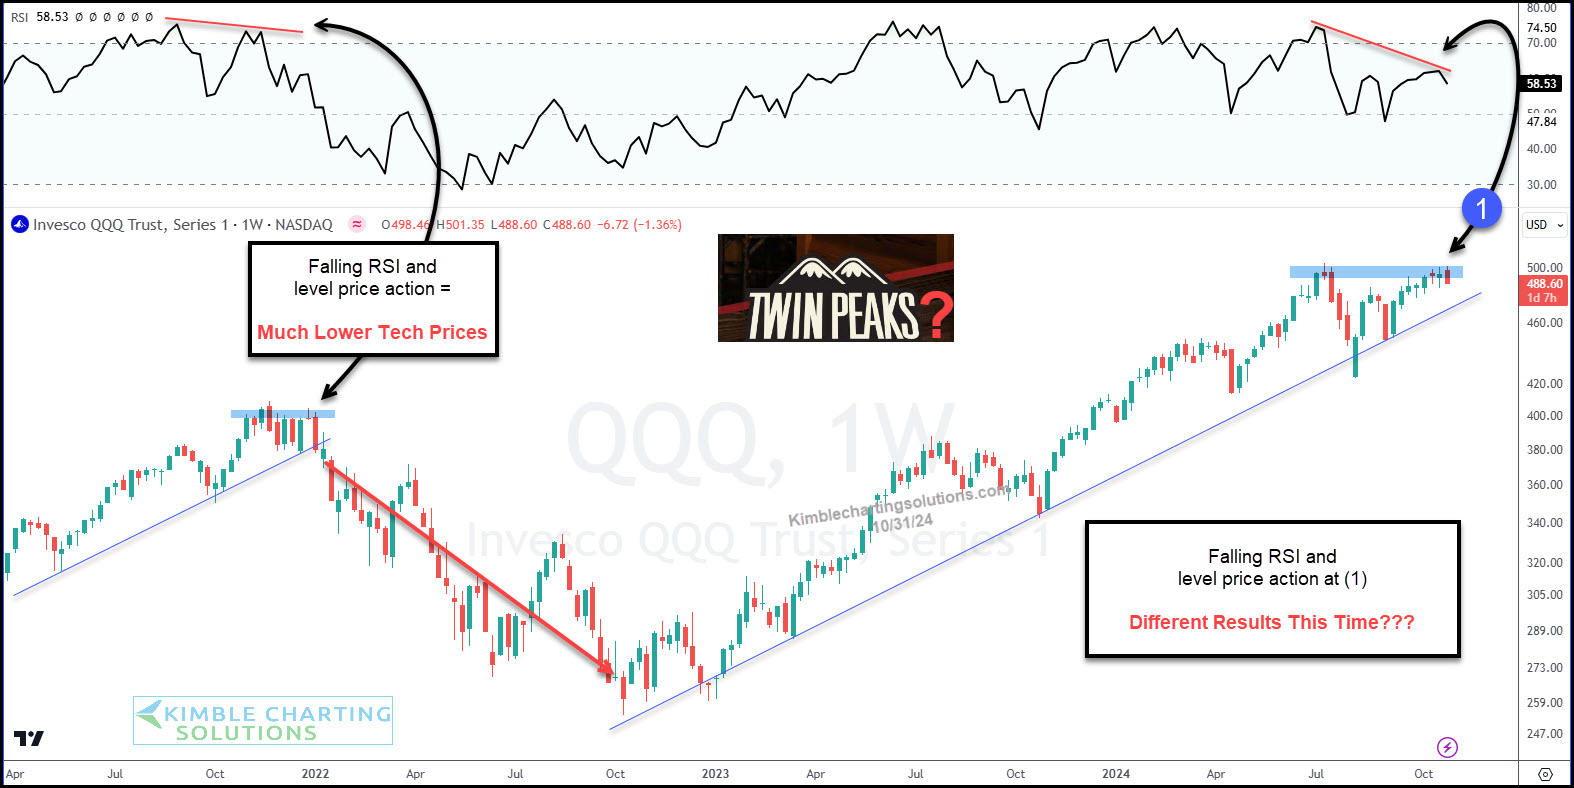
Considering this, today’s “weekly” chart of the Nasdaq 100 shows a few reasons why investors should be cautious near-term and stay tuned.
An eerily similar bearish pattern has emerged in 2024 to one that lead to much lower prices in 2022.
As you can see, we have flat price action along with a falling Relative Strength (RSI) Indicator at (1) just like we had in late 2021/early 2022. And this can be a really bearish combo.
These twin peaks are giving me a case of deja vu. Bulls need to step up soon or lower prices may be in the forecast.
(Click on image to enlarge)

More By This Author:
Are High Yield Spreads Forecasting Another Stock Market Decline?Will Bearish Pattern Take Semiconductors (And The Stock Market) Lower?
Dow Jones Utilities Rally Testing 2022 Highs, Cool Off Level Again?
Disclosure: Sign up for Chris's Kimble Charting Solutions' email alerts--click here.


