

Image Source: Unsplash
Tesla (TSLA) has been a battleground stock for what feels like forever, but since September, it’s been stuck in a choppy, sideways pattern. For traders like me, this kind of price action is a clear signal to pay close attention for a potential trend reversal as distribution played out over a two-plus month period. During this period, a bearish chart pattern has emerged that all traders should be aware of: the double top.
(Click on image to enlarge)
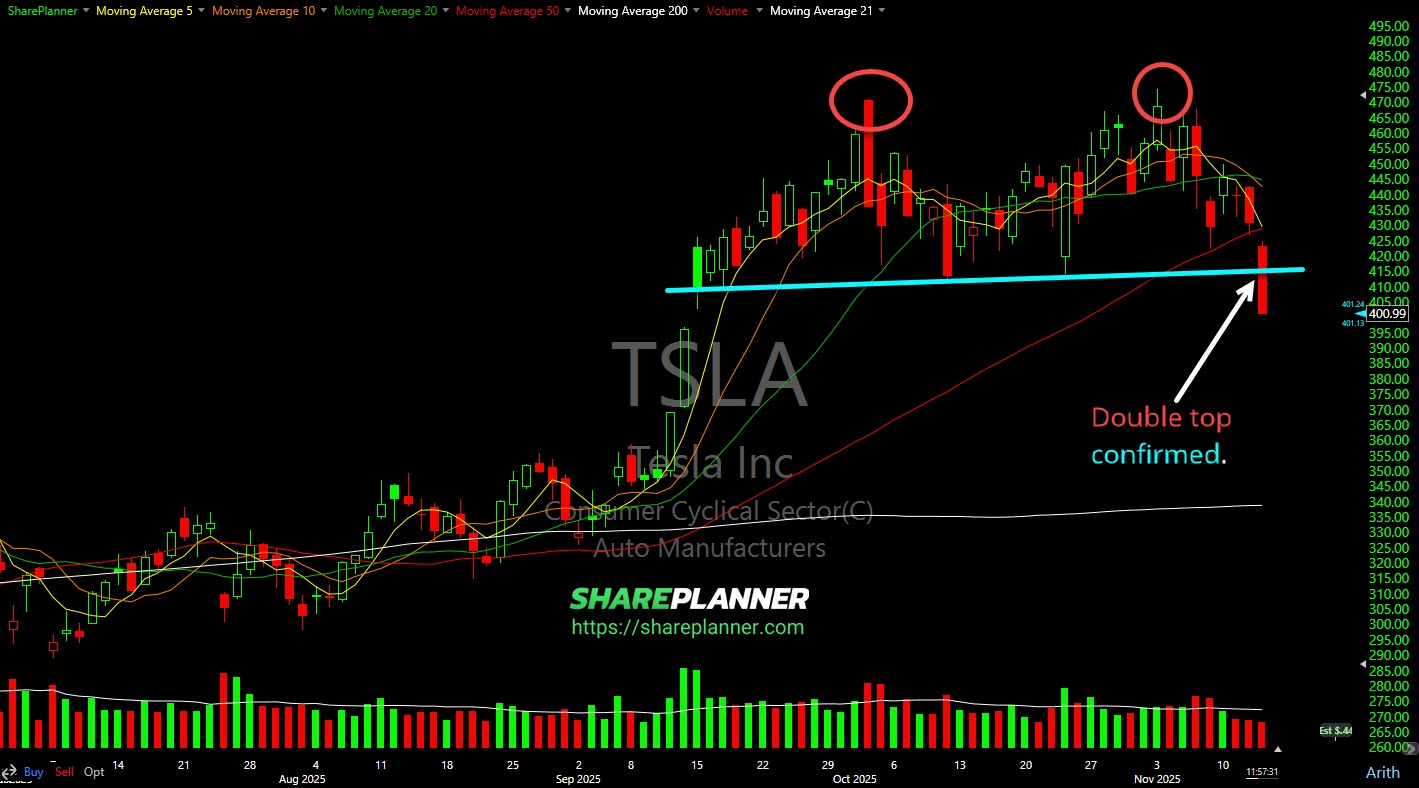
A Double Top Pattern Confirmed in TSLA
For those unfamiliar, a double top is a bearish reversal pattern that looks like the letter “M”. It happens when a stock hits a high price twice with a moderate decline in between. The pattern is confirmed when the price breaks below the support level, which is the low point between the two peaks.
Looking at the TSLA chart, you can see this pattern has been forming since September. The stock has tested the highs twice, unable to break through, which signals that the buying pressure is weakening. The key support level to watch was around $411.
Over the past week, TSLA found some temporary support at its 50-day moving average, which held off the sellers for a bit. It was a moment of truth for the stock. Would it bounce and invalidate the pattern, or would it break down?
Today, we got our answer.
Key Support is Broken
The stock has officially broken below that critical $411 support level. This breakdown happened on strong volume, which adds conviction to the bearish signal. When you see a key support level break on high volume, it’s like a starting pistol for sellers. It tells you that institutional money is likely heading for the exits, and a further decline is probable.
With the double top pattern now confirmed, my next price target for TSLA is around the $356 level. This is the next significant support area where buyers might step back in and try to stop the bleeding. Until then, the path of least resistance appears to be to the downside.
How I’m Approaching the TSLA Double Top Pattern
For me, trading is about managing risk and playing the probabilities. The confirmation of this double top pattern, combined with the break below a major support level on heavy volume, presents a clear bearish signal.
It’s important to remember that no pattern is a guarantee. The market can always throw a curveball. However, based on my experience and technical analysis, the odds now favor the bears. I will be watching TSLA closely to see if it follows through on this breakdown towards the $356 target.
More By This Author:
VIX Higher LowIs Bitcoin About To Top Out?
Is It Time To Buy The Dip On Oracle?


Comments
Log in or sign up to join the conversation.