
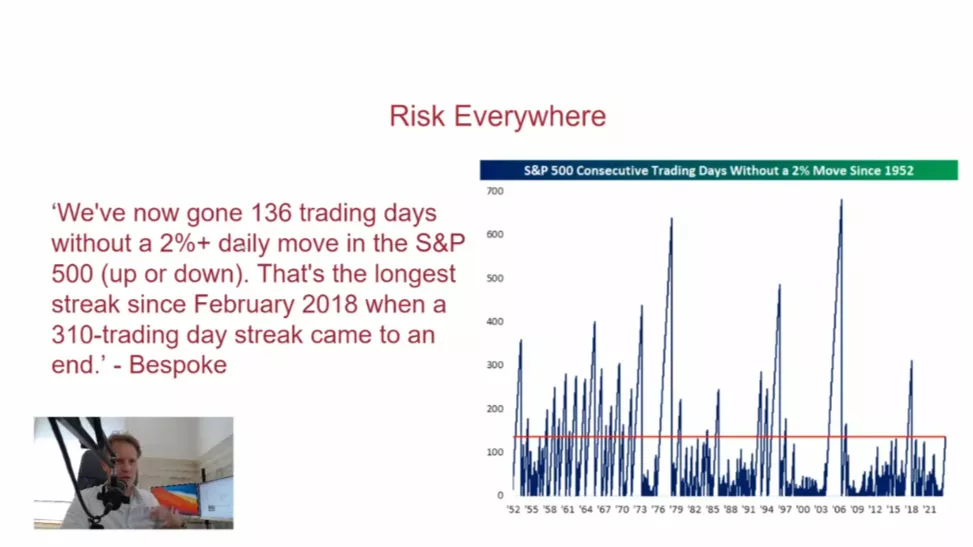
Today, I wanted to quickly show you a “Risk is Everywhere” chart.
The chart has a lot to do with the lack of meaningful one-day volatility in the S&P 500 right now.
Full disclosure, I found this piece of research on Twitter from Bespoke, but it is incredibly fascinating nonetheless.
It talks about there being 136 trading days so far without a 2%+ daily move – however, it’s possible by the time you’re seeing this we’ve had that 3% move.
This is the longest streak since February 2018, this one lasting 310 days.
That was five years ago!
What I find even more interesting on this chart is what tends to happen when there’s finally a move that’s more than 2%…
In today’s 2-minute video, I talk about what happens to the S&P 500 when there’s a 2%+ move and what to keep in mind about the stock market heading into autumn.
I release these weekly tips every Thursday for free, so stay tuned and stay subscribed here.
To watch the video, click here. (Running length 00:01:45)
More By This Author:
The Simple And Profitable Alternative To TradingThis Uranium ETF Is A Bullish Investors’ Dream
How The Pandemic Taught Us The Wrong Thing About Investing


Comments
Log in or sign up to join the conversation.