

Image Source: Pexels
Analyzing the NFLX setup
When you look at the recent price action in Netflix (NFLX), it has been on a long slide since its peak in June. And now today it’s taking another hit of 5% on rumors they may be in play for Warner Brothers Discovery (WBD). Our job swing traders, is to tune out that noise and focus on what really matters: the price action on the chart.
Right now, Netflix is presenting a fascinating technical setup that deserves a closer look. We have seen a steady decline off the June highs, which might scare away the casual investor. However, for those of us who hunt for technical patterns, this pullback is starting to look less like a breakdown and more like an opportunity.
The key here is to manage risk and identify where the buyers are likely to step in. Let’s dive into the charts and see if Netflix (NFLX) is a buy at these levels.
The Current Technical Landscape for NFLX
To understand where we are going, we have to look at where we have been. Since June, Netflix has been stuck in a declining channel. On the surface, a declining channel sounds negative. It has a series of lower-highs and lower-lows, which is the textbook definition of a downtrend. But context is everything in the stock market.
(Click on image to enlarge)
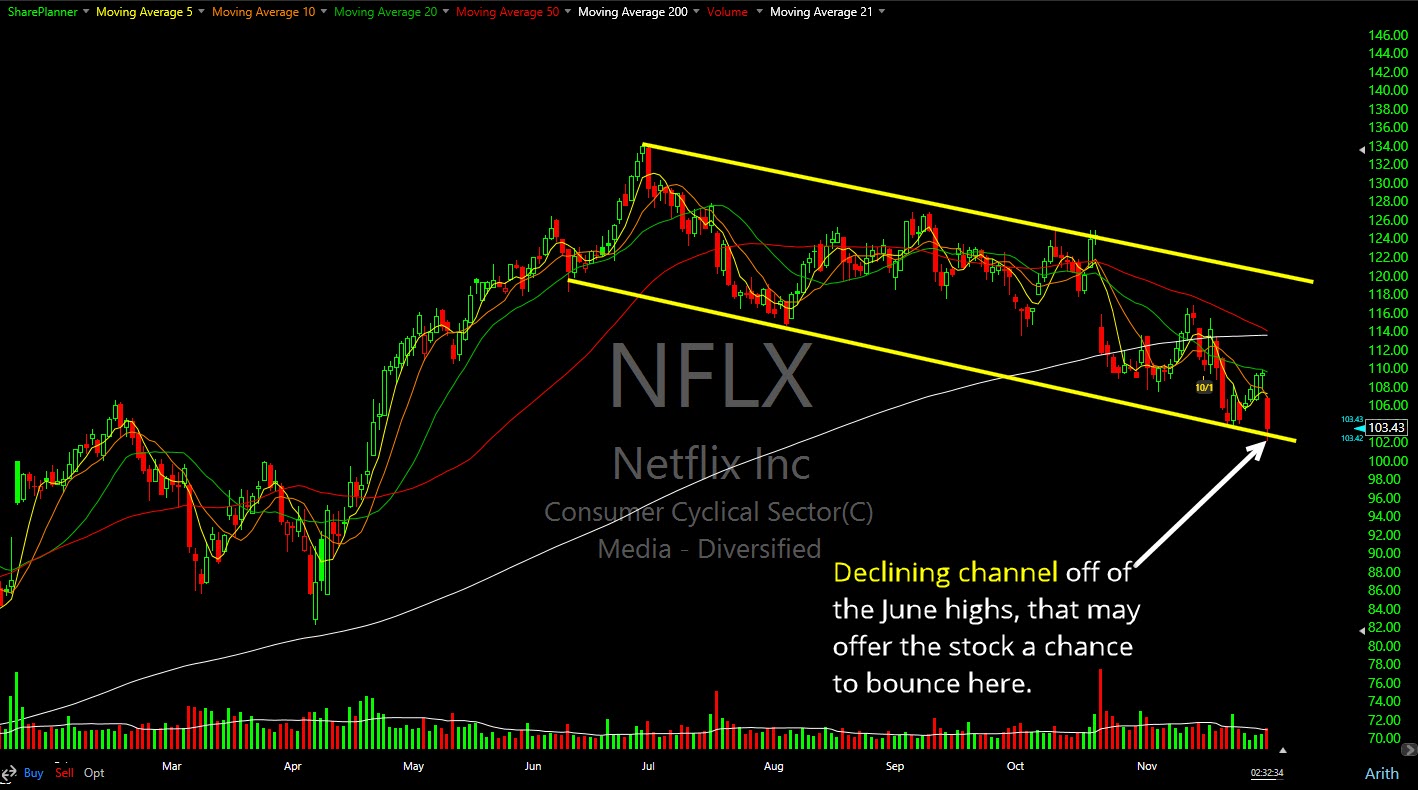
When you zoom out and look at the broader picture, this declining channel is actually forming what appears to be a massive bull flag. A bull flag is a continuation pattern that typically resolves to the upside. It represents a period of consolidation where the stock catches its breath after a significant run-up. The fact that we are testing the lower end of this channel right now is significant.
We are currently sitting right on a rising trend-line that dates back quite a while. This line has acted as strong support in the past, guiding the stock higher over the long term. The convergence of this long-term rising support and the bottom of our short-term declining channel creates a high-probability area for a bounce.
(Click on image to enlarge)

Why This Support Level Matters
In technical analysis, we look for confluence. We want to see multiple technical indicators telling us the same story. Here, we have the price testing that rising trend-line while simultaneously testing the lower boundary of the bull flag.
This dual layer of support suggests that the selling pressure may be exhausted. The bears have had their fun since June, pushing the price down and shaking out the weak hands. But as we hit this critical juncture, the reward-to-risk ratio starts to shift heavily in favor of the bulls.
If this rising trend-line holds, we are looking at a solid bounce opportunity. The immediate target would be a move back to the upper end of the bull flag. Based on the current chart structure, that resistance level sits right around $120.
The Upside Potential
Let’s talk about targets. If we do get the bounce we are looking for, the first major test will be that $120 level. This represents the top of the channel or the upper boundary of our bull flag.
Getting to $120 would be a nice trade in itself. It would confirm that the channel is still intact and that buyers are willing to defend the long-term trend. But the real excitement happens if we can break through that level.
A decisive breakout above $120 would effectively trigger the bull flag. When a bull flag triggers, it often unleashes a powerful move higher as shorts are forced to cover and momentum traders jump on board. If Netflix can clear $120 with conviction, I believe the stock has a legitimate chance to take out its all-time highs.
This is why we watch these patterns so closely. The move inside the channel is the setup, but the breakout from the channel is a much bigger pay-off.
More By This Author:
Trading AES Corp: Will It Break The 50-Day Moving Average?Is Warren Buffett’s GOOGL Bet A Good One?
Is Tesla’s Bull Run Coming To An End?


Comments
Log in or sign up to join the conversation.