
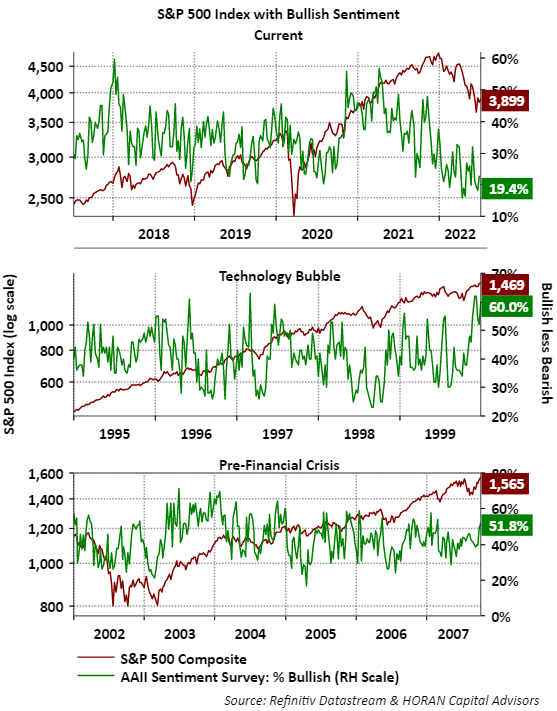
In articles written over the past several months, I have noted both individual and institutional investors have been expressing a low level of bullishness, levels generally associated with equity market bottoms. As is the case with sentiment measures, they do not necessarily point to exact market turning points but do reach a low level near them. Some have called the market advance following the pandemic shutdown the 'stay at home' bubble, conjuring up images of the technology bubble in 2000 and the financial crises bubble in 2007. As the below chart shows, if the market recovery from the pandemic market low led to a bubble, it appears it has been deflated along with individual investors' bullish sentiment.
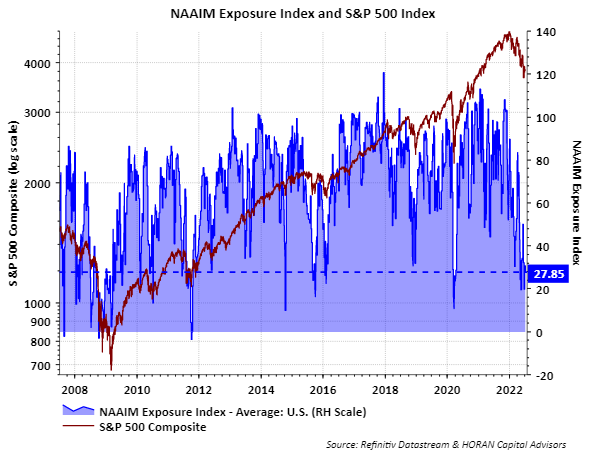
The next chart below shows detail of the NAAIM Exposure Index. The recent reading for this index is 27.85%. The NAAIM Exposure Index consists of a weekly survey of NAAIM member firms who are active money managers and provides a number that represents their overall equity exposure at the market close on a specific day of the week, currently Wednesday. Responses are tallied and averaged to provide the average long (or short) position or all NAAIM managers as a group. Institutional money managers have equity allocations at levels approaching the pre-pandemic low in March 2020.
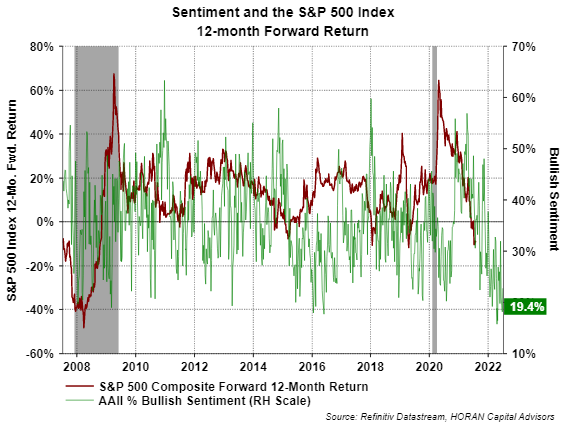
As of July 8, 2022, the S&P 500 Index was down -18.79% for the year. Certainly, further downside is possible, but the start of this year has been a difficult one for investors. Given this low level of bullish sentiment and the commensurate equity market pullback, the maroon line in the below chart shows that 12-month forward returns tend to be favorable for investors.
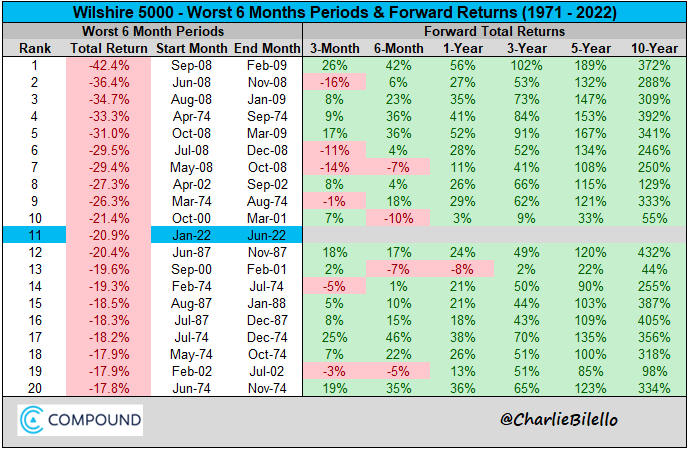
Additionally, the below table constructed by Charlie Bilello shows the twenty worst 6-month periods for the Wilshire 5000 Index. The magnitude of the year-to-date decline for the index this year ranks it as the eleventh worst. In only the September 2000 - February 2001 period was the 1-year forward return negative. For the 3, 5, and 10-year periods, the cumulative returns were all positive. Of course, the market can go lower near term, but a great deal of damage has been done to stocks already.
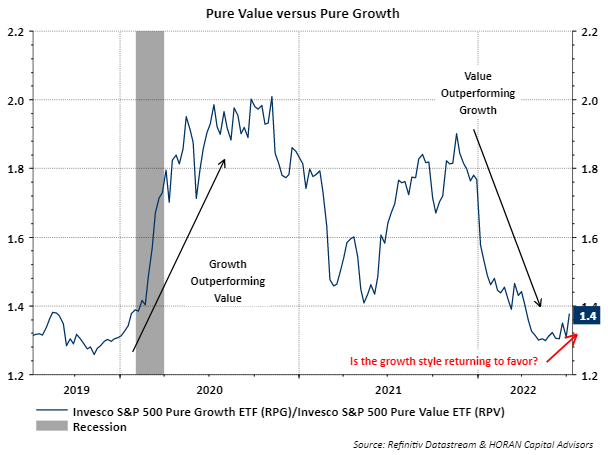
There does appear to be some evidence that investors might be adopting a more 'risk on' tone towards equities. The upward turning blue line at the current date in the below chart indicates pure growth style stocks have been outperforming pure value stocks since near the end of May. There remains a lot of equity market technical damage yet to be unwound to confirm this; however, this is some evidence of investors beginning to rotate out of value into sometimes riskier growth stocks. Importantly, a number of growth stocks have experienced large declines in this market pullback, so this could simply be some dip buying too. Nonetheless, it is evidence of a more risk on comfort level for investors.
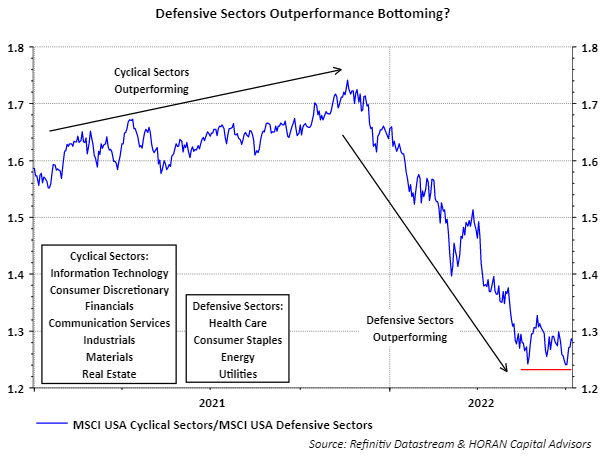
Lastly, the defensive sectors have generated strong outperformance this year relative to the cyclical ones. Also in May, as with the value to growth rotation noted above, the defensive outperformance seems to be bottoming and potentially rotating back to the outperformance of the cyclical sectors. Again, this is a short time frame, but these are a few signs investors may have a more favorable view of the economy and stocks. In fact, since June 21, the S&P 500 index is up 6.05%.
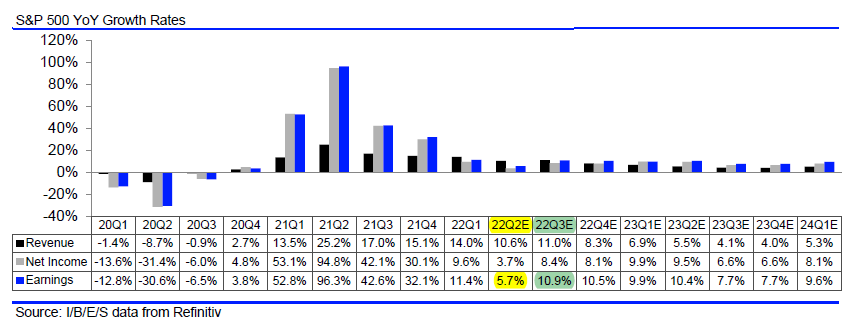
The market has a long way to go to erase year-to-date losses, but recent market action might indicate this is beginning. Second-quarter earnings reporting season gets into full swing beginning the week of July 18 and market volatility is expected around company reports as lower guidance is expected from companies. The below table shows though, that this could be a low point for earnings reports. As is often said, the equity market tends to bottom before the economy.
More By This Author:
Investor Sentiment Remains Decidedly BearishMaybe The Beginning Of An Equity Market Recovery
Might An Equity Market Bottom Be Near?

Comments
Log in or sign up to join the conversation.