
This bear market is punishing everyone and everything. Growth. Value. Large caps. Small caps.
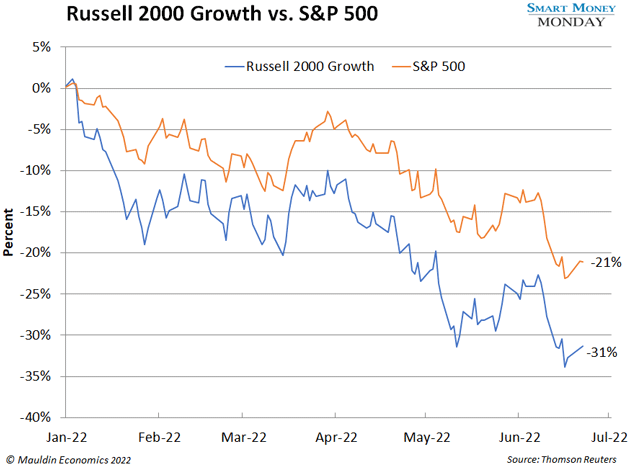
The stock market has tanked 21% since January. But small-cap growth has fared even worse, as you can see in the chart below. The Russell 2000 Growth Index has plummeted by 31%.
There’s a good reason for this. Many small-cap growth companies are not generating profits. Even with all the COVID corporate stimulus, they’re burning through cash. Look at Oscar Health (OSCR) for example. This insurance “disruptor” has tumbled 85% since its March 2021 IPO. And after raising billions, it still doesn’t make money.
-
This whole situation reminds me of the dot-com bust.
If you’ve been investing for a while, you remember what happened. Investors put silly valuations on companies with “dot-com” in their names. Then the house of cards collapsed—the Nasdaq fell 78% from its peak in October 2000 to its low in September 2002.

Meanwhile, Pets.com dropped from $11 to zero in under 12 months. eToys.com dropped from a high near $100 to zero in under 24 months. Dr. Koop.com sank to zero after raising $84 million from investors in 1999.
What’s the one thing all these companies had in common? They were all small-cap growth companies that never made any money.
-
But investors forget a crucial fact about the dot-com bust…
It was an incredible buying opportunity—if you were picky about what you bought.
See, small-cap growth continued to flounder for years. The Russell 2000 Growth Index dropped 26% from March 2000 to December 2005. And investors who bought fast-growing small caps during that stretch kept losing money.
Small-cap value, however, was a whole different story. During that same period, the Russell 2000 Value Index doubled. Put another way, it delivered a 15% compounded return over five years, crushing the Russell 2000 Growth Index and the long-term average market return of 7‒8%.
The question that matters to us now is: Why?
-
Why did small-cap value outperform small-cap growth by such a wide margin?
The answer is simple. And it all comes down to price. Or more specifically, the price you pay for a company relative to the cash flow it generates.
During the dot-com bubble, the market preferred high-growth “story” stocks like Pets.com over cash-generating value companies like pool supplier Pool Corp. (POOL) or insurance brokerage Brown and Brown (BRO). Then the whole market collapsed, just like it has today.
This brought growth stocks down to earth. And it made already cheap-ish, quality value stocks temporarily cheaper. Pool Corp. traded around 10X earnings in 1999 and 2000. Since then, the stock has exploded nearly 70X higher. Brown and Brown traded at a similar multiple at the lows. And its stock has shot up over 12X since.
The same dynamic is playing out today…
-
Longtime readers know that another small-cap index, the S&P 600, is my preferred hunting ground.
The S&P 600 tracks profitable small caps. And the index is cheaper than ever before, with a record-low multiple of forwarding earnings of around 10X.
In other words, the S&P 600 is full of profitable, small-cap value stocks. And they’re trading at bargain levels we haven’t seen in two decades.


Comments
Log in or sign up to join the conversation.