
How To Interpret Current Market Behavior
As a trader, you have so many options when it comes to interpreting current market behavior. And therein lies the problem: where do you start?
Because less is more, I always start with price action (the king of the indicators).
How to interpret current market behavior
Below is the S&P 500 chart, which we’ll reference throughout this post:
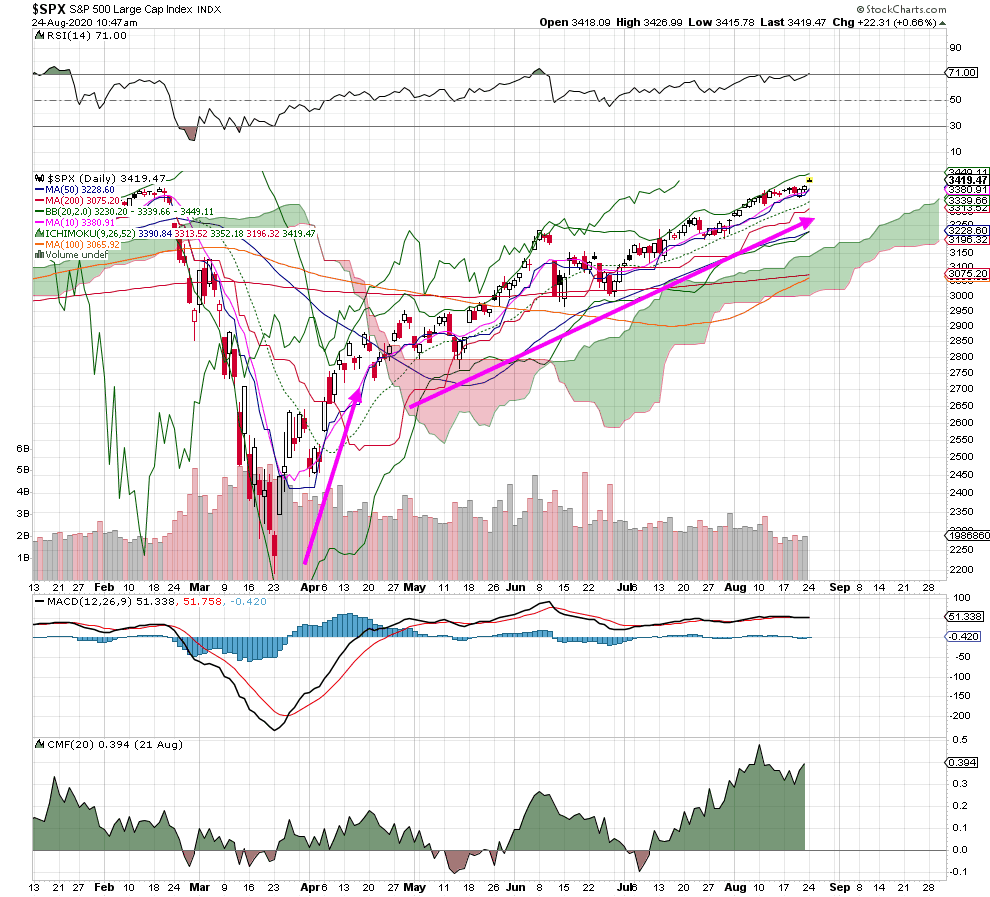
Price action
Price action is the best way to interpret the current condition. Looking to the chart, you can see clearly the bullish price action since the late March bottom. (Remember: we don’t pick a bottom. Instead, we wait until higher lows and an upward trend are established. Likewise, we acknowledge divergences, put up a yellow flag and proceed with caution.)
Put/call ratio
Though the current price action is strong, some supporting indicators are wobbly. The put/call ratios were declining for months but are starting to rise up. This means a lot more traders are buying puts as a hedge against their portfolio. This behavior could be considered bearish.
Breadth
Traders have been complaining that breadth won’t confirm a bull trend. In July, breadth indicators were hitting all time highs. However, the markets were too hot and needed a cool down. New highs are still dominating new lows, albeit at a lower level than in July. That’s fine, as long as the breakdown is not severe.
Divergences
Divergences occur when the price of an asset moves in the opposite direction of an indicator. Like I said above, they are important to note, but the trend matters most. On a medium-term horizon, the chart shows a moderate divergence, marked by a decline from above the 50 ma. This has been happening for a couple of weeks, and bears are watching. If stocks are not going up, they are going down.
Alpha stocks
There’s also been a lot of talk about a small group of stocks pushing the indices higher. I don’t see that happening right here and now. Frankly, it’s those who are not engaged in the market who are complaining about Apple and Tesla. If you look around, you will see sector improvements in housing, retail, discretionary, construction, metals, technology, biotech and gold and silver.
As you look to the indicators and interpret current market behavior, be objective. Once you cut through the noise, you’ll see that the S&P 500 is pretty healthy and may continue on this path. If price action starts to falter, we’ll have to change our trading strategy. But for now, it’s still GAME ON.

Comments
 No Thumbs up yet!

