
Here's Where The S&P 500 Could Be In 20 Years
This year has been an extremely volatile year on Wall Street, but the S&P 500 has made very little progress one way or the other year to date. In fact, the SPDR S&P 500 ETF Trust SPY is up just 0.7% overall as 2020 is heading into the fourth quarter.
The first-quarter market sell-off and subsequent economic shutdown lured a number of young investors and first-time investors into the market. Some of these traders are trying their hand at trading the COVID-19 volatility, but some are in it for the long haul.
On Friday, September 25, DataTrek Research co-founder Nicholas Colas took a closer look at what that long haul may look like and what investors can expect from the S&P 500 over the next 20 years.
The Numbers
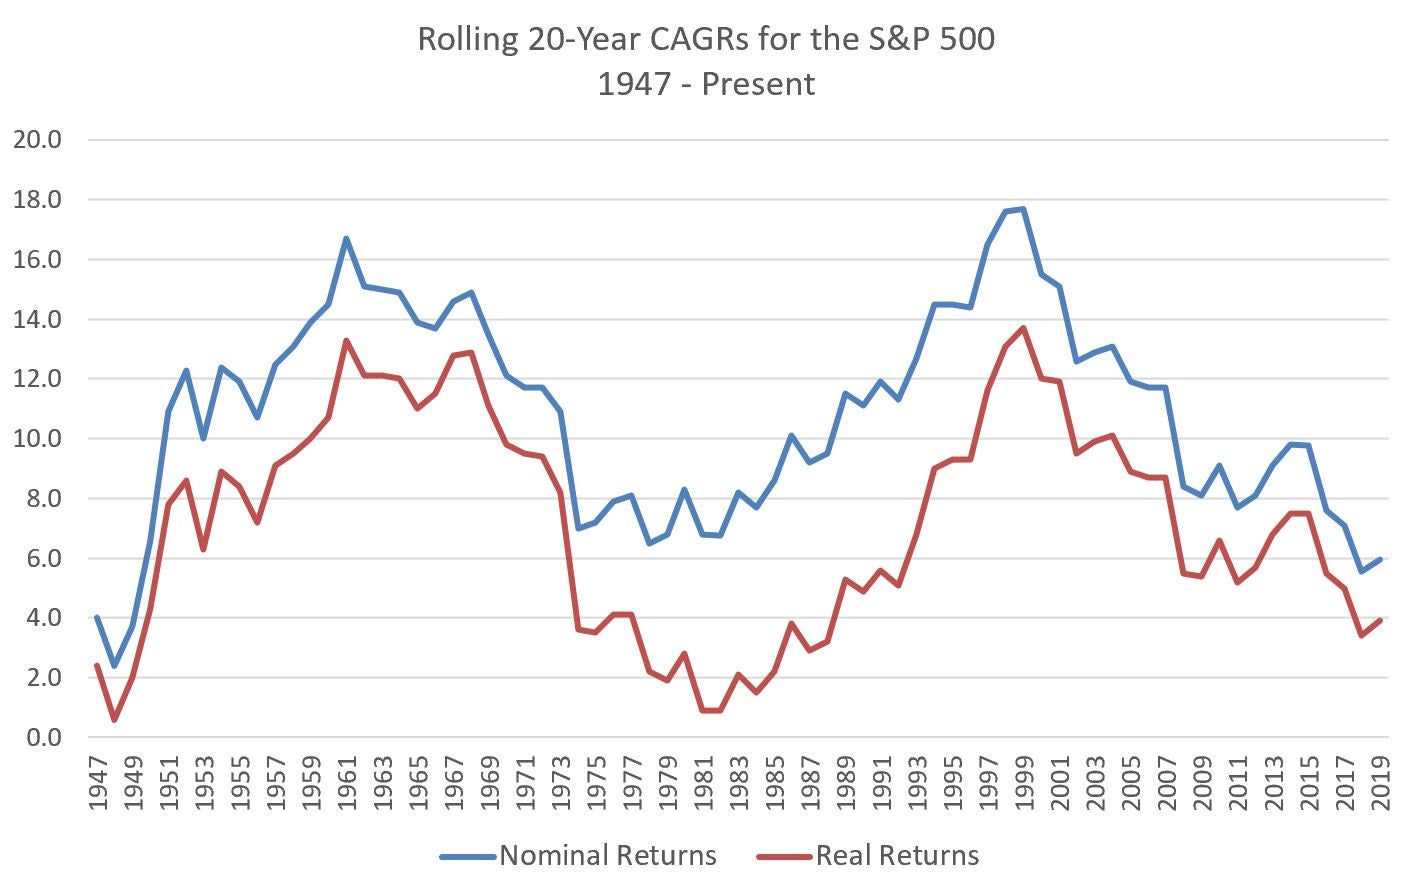
Over the past 72 years, the S&P 500 has averaged a 10.9% compound annual growth rate (CAGR). Colas looked at the rolling 20-year S&P 500 annual returns dating back to 1947 on both a real and nominal basis. Nominal returns are simply the net change in S&P 500 price over time, whereas real returns adjust for inflation and fees.
Colas said historical peaks and troughs in 20-year rolling returns always have a story behind them. The lowest 20-year rolling return came in 1948 when nominal returns were just 2.4% and real returns were 0.6% due to the Great Depression. The highest 20-year rolling returns came in 1999 when nominal returns were 17.7% and real returns were 13.7% due to the dot com bubble.
Colas said there are several important takeaways from the long-term data.
First, there is no precedent for negative S&P 500 returns over any 20-year stretch. Even investors who bought the S&P 500 in 1928 just prior to the stock market crash and the Great Depression made positive nominal and real gains over the next 20 years.
Second, 20-year rolling annual returns above 14% are rare throughout history. Without a powerful positive catalyst, Colas said it’s unlikely the S&P 500 will exceed that level over the next 20 years.
The Target
Using the 0% to 14% historical return range, Colas said it’s reasonable to expect roughly a 7% CAGR from the S&P 500 over the next 20 years.
“It’s easier to argue for better than that number, because technology should deliver outsized productivity gains which will boost overall corporate profits. The bearish side of 7% anchors on demographics (sub 1% population growth in the US, zero in Europe, and actually pretty slow in China as well) and the increasing frequency of investment bubbles,” Colas wrote.
Given there are no major tailwinds from lower interest rates and macro growth, Colas said innovation will ultimately decide whether or not S&P 500 returns are on the high end or the low end of that 0% to 14% range over the next two decades.
If the S&P 500 does compound 7% annually over the next 20 years, the index will reach roughly 12,560 by 2040.
Benzinga’s Take
The longer you extend the timeframe, the more consistent S&P 500 returns have been throughout history. Despite a number of market booms and busts — World War II, the Great Depression, the Financial Crisis, and any number of major economic disruptions — the 30-year rolling annual return of the S&P 500 has always stayed between around 8% and 15%.
© 2020 Benzinga.com. Benzinga does not provide investment advice. All rights reserved.


Excellent, I should just forget timing the market and set it and forget it for 20 years. Good article.