GOOG Stock Could Offer 10% Discount After Pullback
The Alphabet Inc (GOOG) is building a bearish retracement within a strong uptrend. Our article reviews the key bull and bear lines.

Photo by Mitchell Luo on Unsplash
This will determine whether a deeper pullback against the trend will take place. Or will the bulls manage to continue higher in the trend.
Price Charts and Technical Analysis
(Click on image to enlarge)
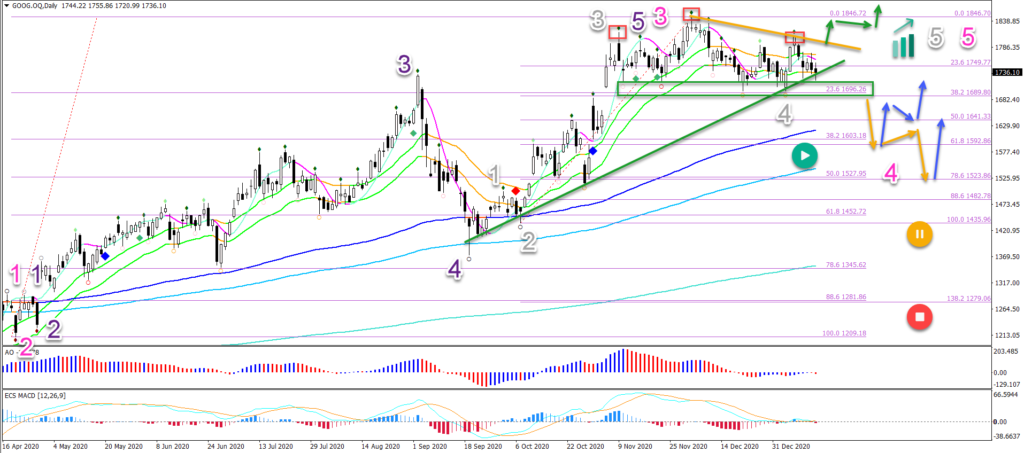
The GOOG stock is showing a head and shoulders reversal chart pattern (red boxes). The support line (green) is the main decision zone for a potential reversal.
- A bearish breakout (orange arrows) confirms the deeper bearish retracement towards the long-term moving averages and Fibonacci levels.
- It also confirms the deeper wave 4 (pink) development rather than the shallower wave 4 (grey).
- An immediate breakout (green arrows) above the resistance (orange) indicates a potential uptrend continuation.
- The Fibs are expected to act as a bouncing spot (blue arrows).
- Only a deeper retracement places the uptrend in question (yellow & red circles).
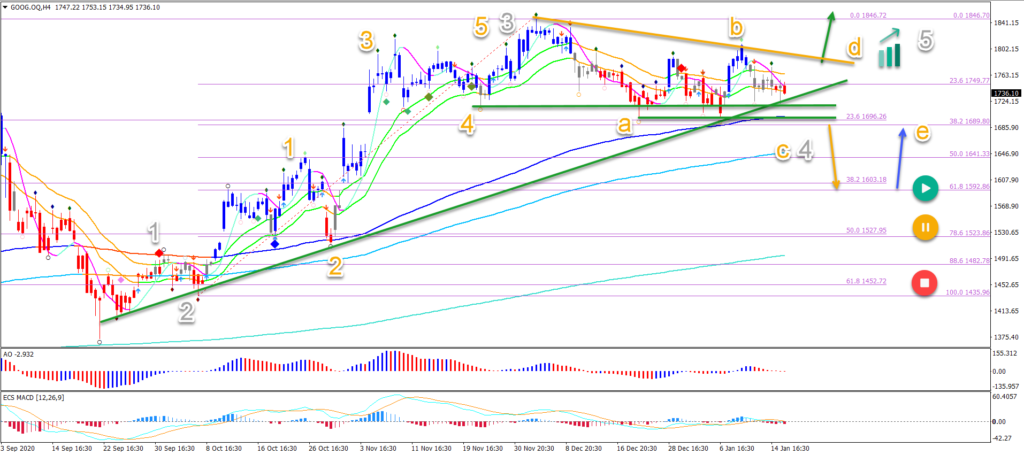
On the 4 hour chart, the sideways price action is an ABC (orange) pattern. The main question is whether the ABC pattern is complete OR will price action expand it.
- The end of the ABC is confirmed by a bullish breakout.
- The continuation of the ABC pattern can take place with 2 variants:
- ABCDE triangle chart pattern
- Deeper ABC retracement after bearish breakout
In all cases, an uptrend is expected eventually. Unless price pushes below the $1,500 round level.
(Click on image to enlarge)
Disclaimer: The opinions in this article are for informational and educational purposes only and should not be construed as a recommendation to buy or sell the stocks mentioned or to solicit ...
more


couldya say that in sentences,not good fallowing graphs----would like to know if you think alphabet a buy,thanks