
Goldman Sachs - Buy Signals
Summary
- 88% technical buy signals.
- 18 new highs and up 27.95% in the last month.
- Analyst's price targets from $290 to $477.
The Chart of the Day belongs to the financial services company Goldman Sachs (GS). I found the stock by sorting the Russell 3000 Index stocks first by the most frequent number of new highs in the last month and having a Trend Spotter buy signal then used the Flipchart feature to review the charts for consistent price appreciation. Since the Trend Seeker first signaled a buy on 10/24 the stock gained 16.20%.
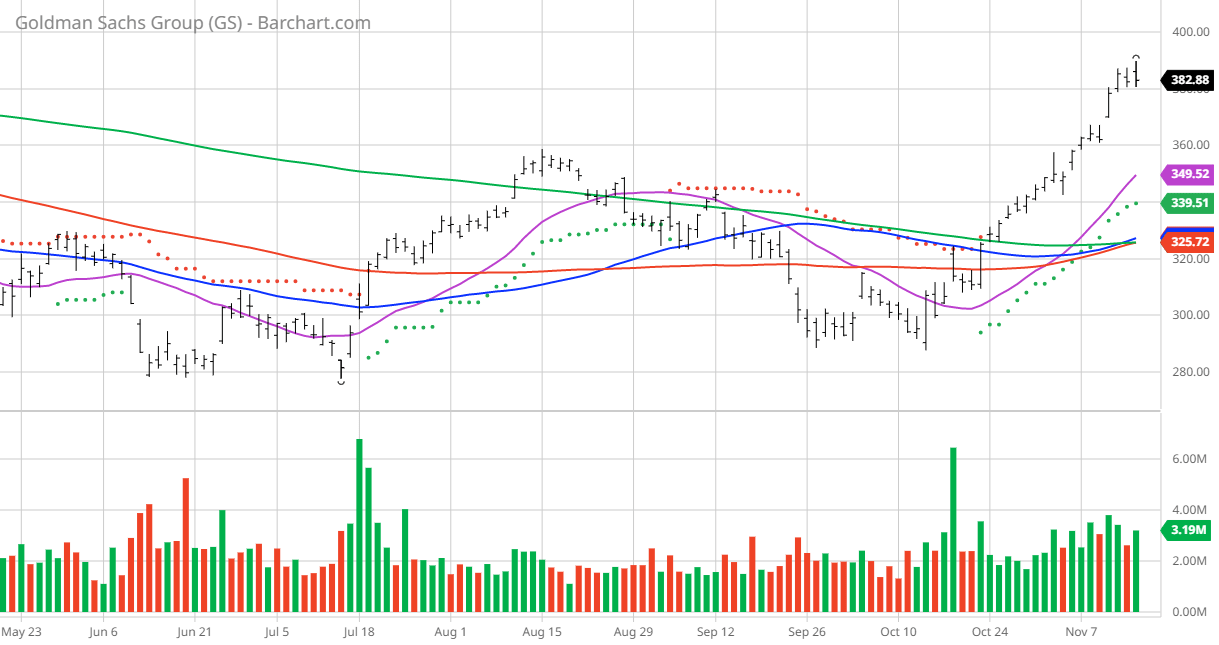
GS Price vs Daily Moving Averages
The Goldman Sachs Group, Inc., a financial institution, provides a range of financial services for corporations, financial institutions, governments, and individuals worldwide. It operates through four segments: Investment Banking, Global Markets, Asset Management, and Consumer & Wealth Management. The company's Investment Banking segment provides financial advisory services, including strategic advisory assignments related to mergers and acquisitions, divestitures, corporate defense activities, restructurings, and spin-offs; middle-market lending, relationship lending, and acquisition financing, as well as transaction banking services. This segment also offers underwriting services, such as equity underwriting for common and preferred stock and convertible and exchangeable securities; and debt underwriting for various types of debt instruments, including investment-grade and high-yield debt, bank and bridge loans, and emerging and growth-market debt, as well as originates structured securities. Its Global Markets segment is involved in client execution activities for cash and derivative instruments; credit and interest rate products; and provision of equity intermediation and equity financing, clearing, settlement, and custody services, as well as mortgages, currencies, commodities, and equities-related products. The company's Asset Management segment manages assets across various classes, including equity, fixed income, hedge funds, credit funds, private equity, real estate, currencies, and commodities; and provides customized investment advisory solutions, as well as invests in corporate, real estate, and infrastructure entities. Its Consumer & Wealth Management segment offers wealth advisory and banking services, including financial planning, investment management, deposit taking, and lending; private banking; and unsecured loans, as well as accepts saving and time deposits. The company was founded in 1869 and is headquartered in New York, New York.
Barchart Technical Indicators:
- 88% technical buy signals
- 9.58+ Weighted Alpha
- 5.18% loss in the last year
- Trend Seeker buy signal
- Above its 20, 50 and 100 day moving averages
- 18 new highs and up 27.95% in the last month
- Relative Strength Index 78.80%
- Recently traded at $382.88 with 50 day moving average of $327.25
Fundamental factors
- Market Cap $129 billion
- P/E 10.26
- Revenue expected to be down 18.80% this year and up 5.10% next year
- Earnings estimated to decrease 42.40% this year and increase by 9.80% next year and continue to compound downward at an annual rate 9.12% for the next 5 years
Analysts and Investor Sentiment -- I don't buy stocks because everyone else is buying but I do realize that if major firms and investors are dumping a stock it's hard to make money swimming against the tide:
- Wall Street analysts have 10 strong buy, 6 buy, 8 hold and 1 sell opinion in place on this stock
- Analysts have price targets from $290.00 to $477.00 with an average of $387.07
- The individual investors following the stock on Motley Fool voted 5,344 to 681 for the stock to beat the market with more experienced investors voting 1,080 to 98 for the same result
- 193,090 investors are monitoring this stock on Seeking Alpha
More By This Author:
Unum Group: Great Insurance Play
Cenovus Energy: Technical Support Level At 20.83
Vertex Energy Recycles Petroleum
Disclosure: I/we have a beneficial long position in the shares of GS either through stock ownership, options, or other derivatives.
Disclaimer: The Barchart Chart of the Day highlights ...
more

