
Goldman Rings The Alarm On Collapsing Market Breadth: 51% Of All Market Gains Since April Are From Just 5 Stocks
A few days ago, with the Nasdaq at all-time highs, we showed a striking chart: barely 40% of the Nasdaq's 3,000+ stocks were trading above their 200 day moving average.
(Click on image to enlarge)
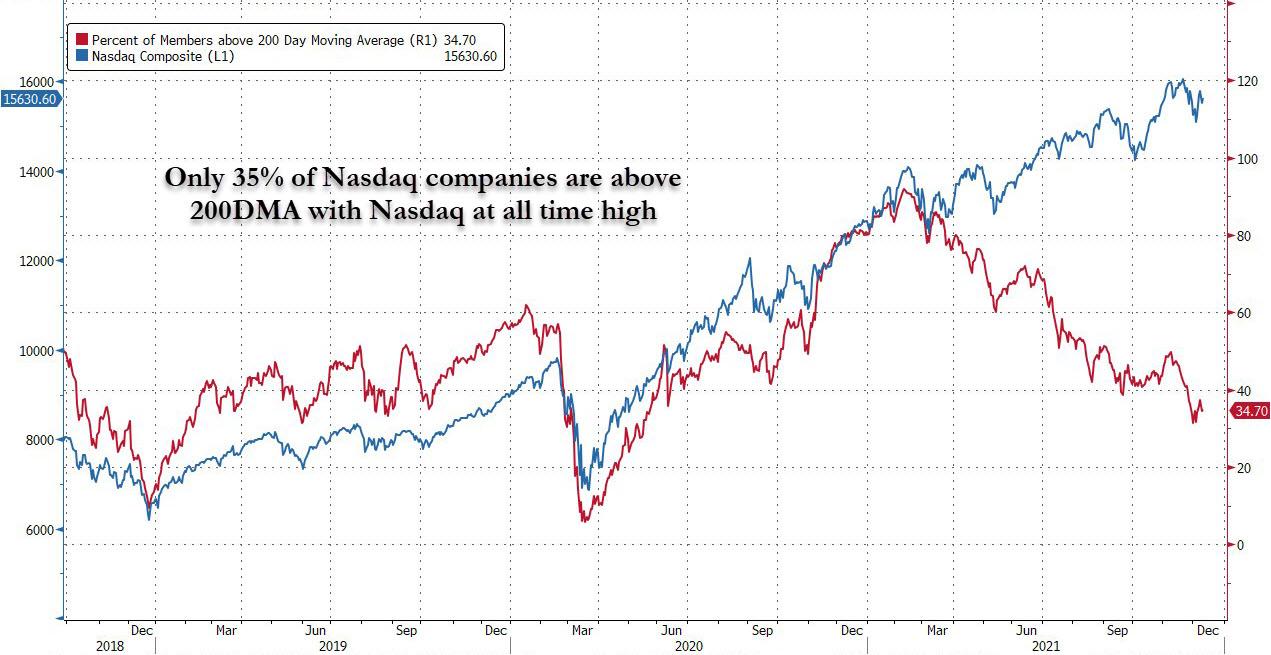
While not nearly as dramatic, a chart comparing the broader S&P and the median stock (via the Value Line Geometric) showed a similar theme: barely a handful of stocks were propelling the entire market higher, and it's also why two weeks ago we summarized the current state of affairs "They better not start selling the generals"
They better not start selling the generals pic.twitter.com/3RHZsrn4QI
— zerohedge (@zerohedge) December 1, 2021
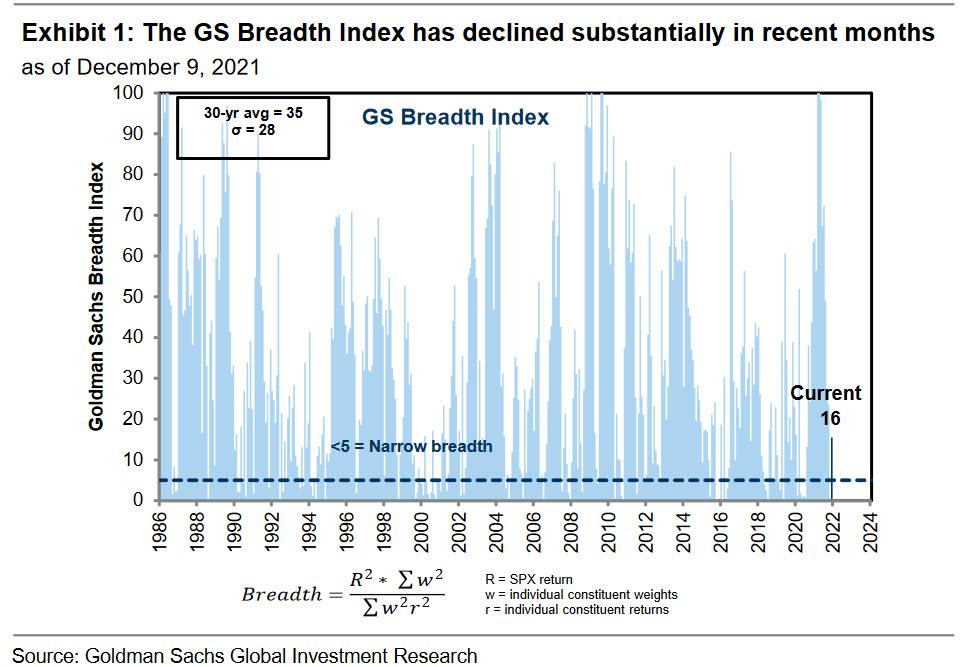
A few days later none other than Goldman's chief market economist David Kostin, admitted that while most S&P 500 stocks participated in the rally between November 2020 and April 2021, "market breadth has narrowed substantially in recent months." As shown in the chart below, after Goldman's Breadth Index hit its maximum level of 100 in April 2021, it has since fallen to the current near-record low level of 16.
Similarly, the S&P 500 Equal-Weighted Index outperformed the S&P 500 by 7% from November to April (25% vs. 18%) but has underperformed by 5% since (7% vs. 12%).
(Click on image to enlarge)
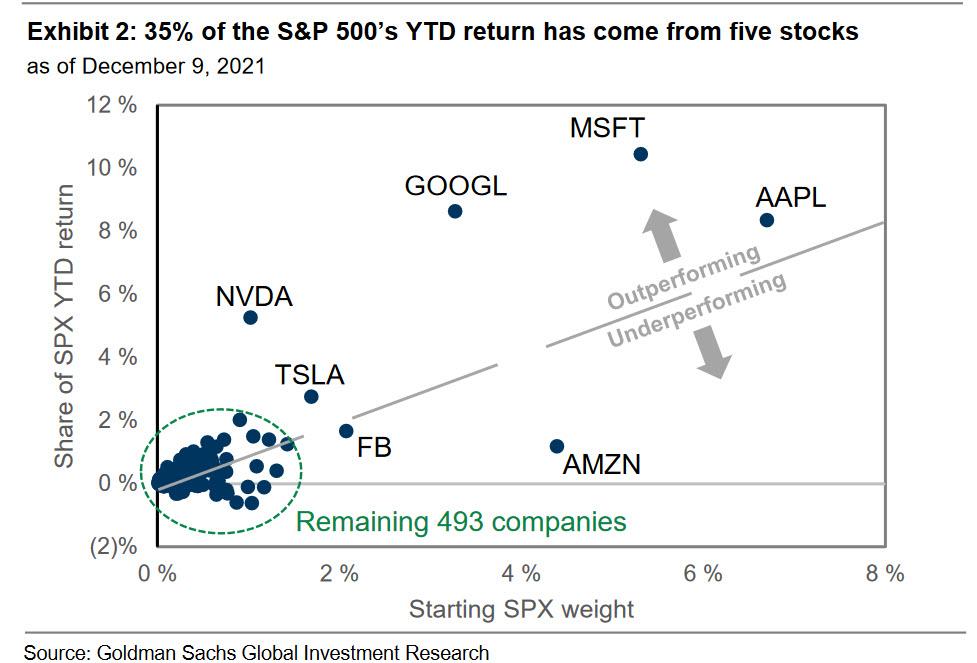
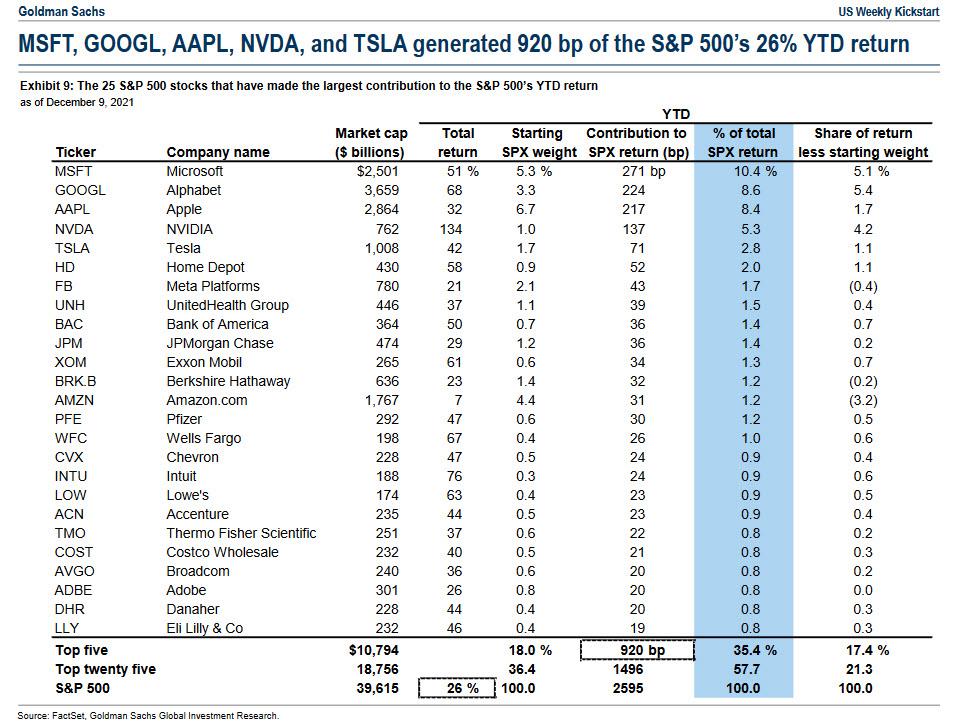
Goldman then calculates that just the five most popular tech names - AAPL, MSFT, NVDA, TSLA, GOOGL - have contributed 51% of S&P 500 returns since April. After contributing over double their starting weight to the index’s return, these stocks now make up 22% of the S&P 500 by market cap, a 4% increase from the start of the year.
(Click on image to enlarge)
Outside of these 5, the table below shows the 25 S&P 500 stocks that made the largest absolute contributions to the index YTD.
(Click on image to enlarge)
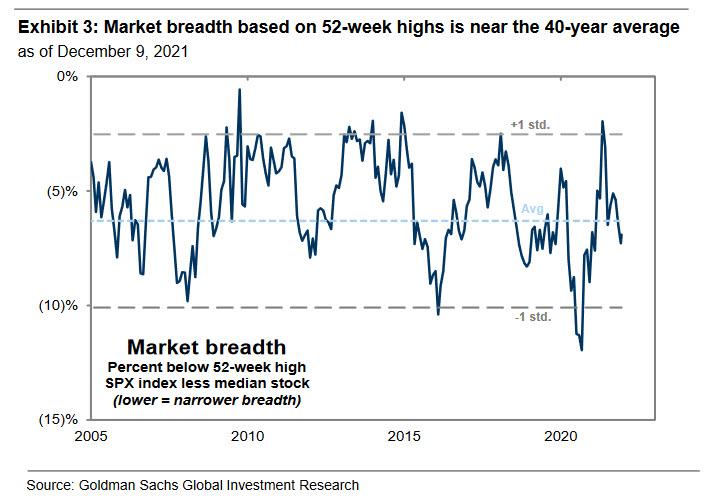
Why does this matter? Because as we have observed over the years and as Kostin wrote over the weekend, the amount of concentration is directly proportional to the odds of a major market shock. As Goldman further explains, one measure of market breadth that has historically carried a forward-looking signal for equity market performance compares how far the S&P 500 index and its median constituent trade from their respective 52-week highs. When the index is much closer to its 52-week high than the median stock, this breadth measure plunges and signals that a small number of stocks are driving index returns. This measure of breadth registered more than one standard deviation above average as of April 2021 (highest level since 2014) before falling by 4.5% during the subsequent six months.
(Click on image to enlarge)

Today it sits at about its 40-year average.
(Click on image to enlarge)
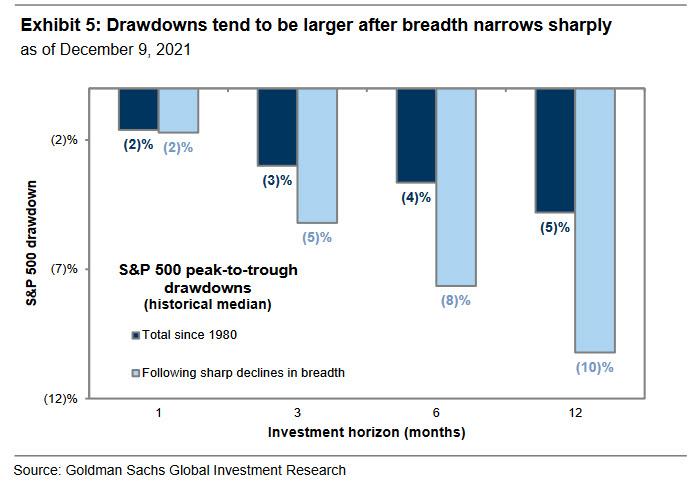
While that in itself is hardly alarming, Kostin then notes that following periods of sharply narrowing market breadth – similar to the recent experience – equities have historically exhibited weaker-than-average returns and deeper drawdowns, and Goldman's previous analysis shows that changes in market breadth can be a useful signal for near-term equity market returns.
Specifically, since 1980, there have been 11 episodes in which market breadth has narrowed by as much during a 6-month period as it did from April to October 2021. This dynamic also occurred in Sep 2007, May 2015, and Sep 2018, among others. Following most of these episodes, the S&P 500 generated a below-average return over the subsequent 1, 3, 6, and 12 months. The S&P 500 also experienced sharper peak-to-trough drawdowns in the months following these episodes.
These dynamics likely explain the current period of market weakness: amid the current period of narrowing breadth, the S&P 500experienced a sharp but short-lived 4% drawdown, when both the discovery of the Omicron variant and fears of more hawkish Fed policy helped to drive the post-Thanksgiving S&P 500 decline. At the same time, the VIX and put-call skew both spiked as the market sold off. Low liquidity contributed to the speed of the decline. In part due to positive news about vaccine efficacy against the Omicron variant, the market also recovered quickly, returning 4% during the week following December 1st and lifting the S&P 500 to its 67th all-time high of 2021 at Friday’s close.
Unfortunately for the bulls, periods of narrowing market breadth tend to persist over the short-run, and following market breadth declines of the recent magnitude, it has historically taken 4 additional months before a sustained increase in breadth takes hold and market leadership flips towards the previous laggards, according to Goldman calculations. As an aside, record index concentration is both a cause and a symptom of a narrow market. The market-cap weight of the 10 largest stocks in the index has increased for each of the past 7 years and now registers at 31%, the highest level since at least 1980.
So does one sell everything? Well, according to Goldman, momentum “leaders” tend to outperform following sharp drops in market breadth, reflecting the fact that periods of narrow market breadth tend to persist.
As shown in the chart below, Goldman's long/short momentum factor has returned roughly +1% in the typical six-month period since 1980. However, following six-month declines in market breadth greater than 4.5%, the factor has returned +14% on average GOOGL.
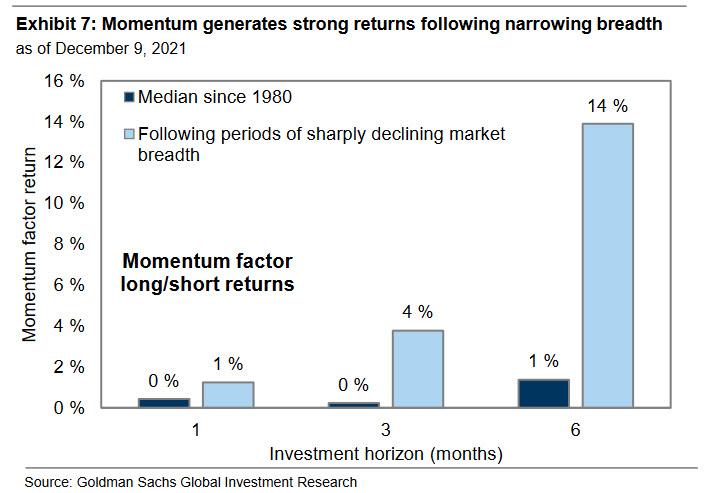
Not surprisingly, the giga-techs, MSFT, NVDA, and TSLA are all constituents of the long momentum factor today, and as Goldman notes, "the historical experience along with the strong growth prospects of these large stocks suggest they may continue to drive the equity market in the coming months" even though as Kostin concedes, "given narrowing market breadth and growing macro risks, clients frequently ask us whether there is an elevated likelihood of a larger drawdown in the coming months. Concerns include virus spread, higher-than-expected inflation, continued supply chain difficulties, and highly valued corners of the market. The most commonly asked question about risks faced by investors relates to the potential impact of accelerated Fed tapering and early lift off."
And while everyone is fixated on tomorrow's Fed announcement when Powell is expected to announce a "turbo taper" doubling the pace of tapering to $30BN, Morgan Stanley - which has long been bearish on risk assets - believes that this news will trigger market chaos over the next 3-4 months. On the other hand, Goldman is more sanguine and says that even though its own research indicates a drawdown is imminent, it goes on to note that "while unknown unknowns cause the largest drawdowns and by their nature are impossible to assess in advance, the macro environment does not suggest drawdown risk is elevated in the coming months." And here's why Goldman is confident that all is well despite a flashing red alert from the near record market concentration:
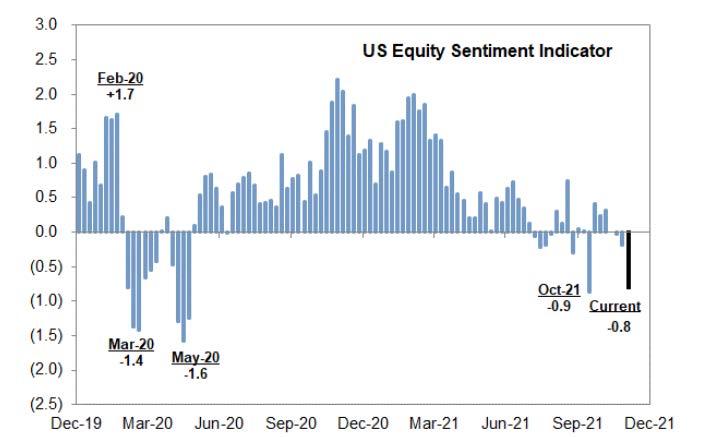
While difficult to predict, the risk of a recession appears low. Earnings and margins continue to surpass expectations. Meanwhile nominal and real rates are expected to rise but remain low over the coming months, supporting the backdrop for both valuation and equity demand. The positioning outlook has also become more constructive since the end of summer. Our Sentiment Indicator, which tracks the positioning of retail, institutional, and foreign investors, registered -0.8 last week and -1.0 this week. Data from GS Prime Brokerage also suggests hedge fund leverage has declined in recent weeks.
As a result, Goldman continues to recommend "investors own high growth, high margin stocks. These stocks have performed well in recent months and this should continue provided narrowing breadth persists."
Finally, and speaking of Morgan Stanley, while the bank has a far more negative view of where the market is going (down to 4,400 by end of 2022 vs Goldman's 5,100 price target), the bank agrees with Goldman's dismal breadth view and as Michael Wilson writes, since September, breadth has rarely been this weak relative to the Index level price.
(Click on image to enlarge)
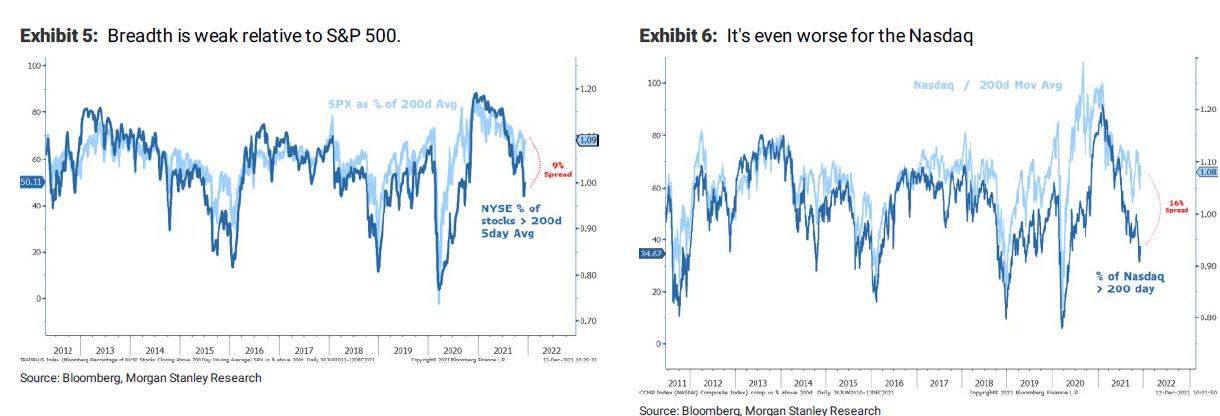
And courtesy of Wilson here is a far more appropriate conclusion for what the breadth collapse means: "the rolling correction that began last spring continues under the surface, making the index a very bad gauge of the overall health of the stock market, or the economy, in our view. The good news is that the average stock has already discounted a good chunk of the risks we are forecasting even if the index has not. In this regard, we continue to stress that watching the S&P 500 is a bad idea for measuring what the market is really telling us about the fundamentals. It also explains why it's been so difficult for many active managers to keep up with the benchmark. While the average stock may begin to outperform as the index catches down, the absolute direction for most stocks will remain lower until the index has taken its turn on the de-rating process that began over 6 months ago. It's also why we remain overweight large cap defensive quality for now."
Disclaimer: Copyright ©2009-2021 ZeroHedge.com/ABC Media, LTD; All Rights Reserved. Zero Hedge is intended for Mature Audiences. Familiarize yourself with our legal and use policies every ...
more

