
Let’s take a look at some updated daily index charts, shall we?
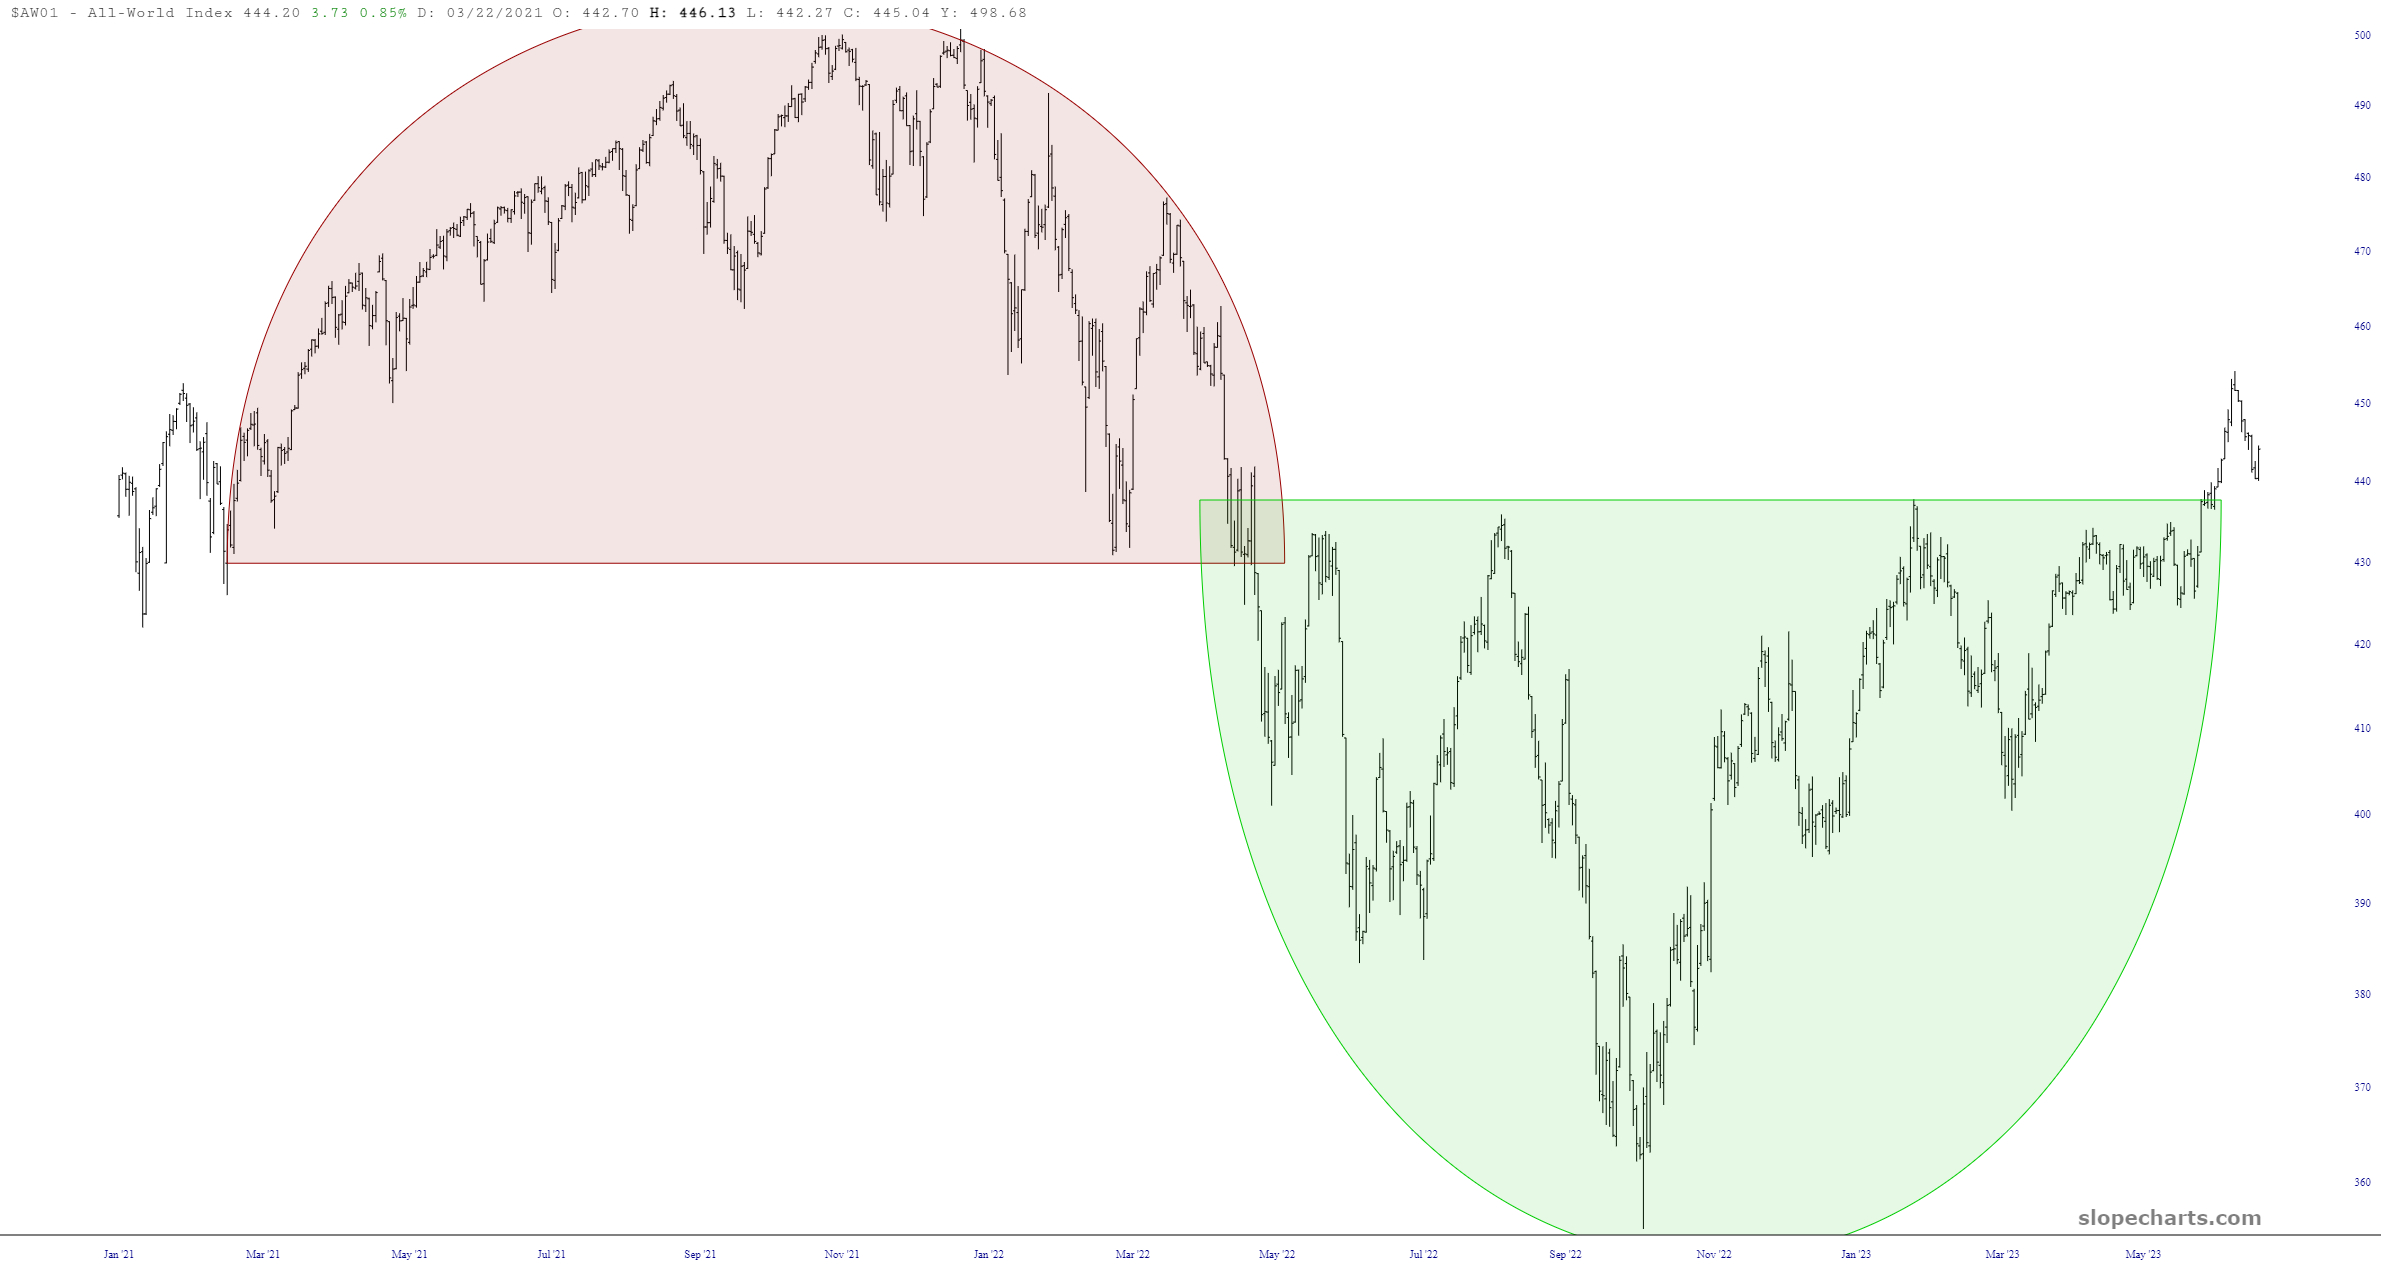
We begin with the All World Index. The “face-off” is still unresolved, but the bulls still have the upper hoof. The green tinted area is the bullish base, and even during last weeks’ modest sell-off, we did not pierce this zone. In order for the bears to have a prayer, prices need to sink back into that green price zone.
(Click on image to enlarge)
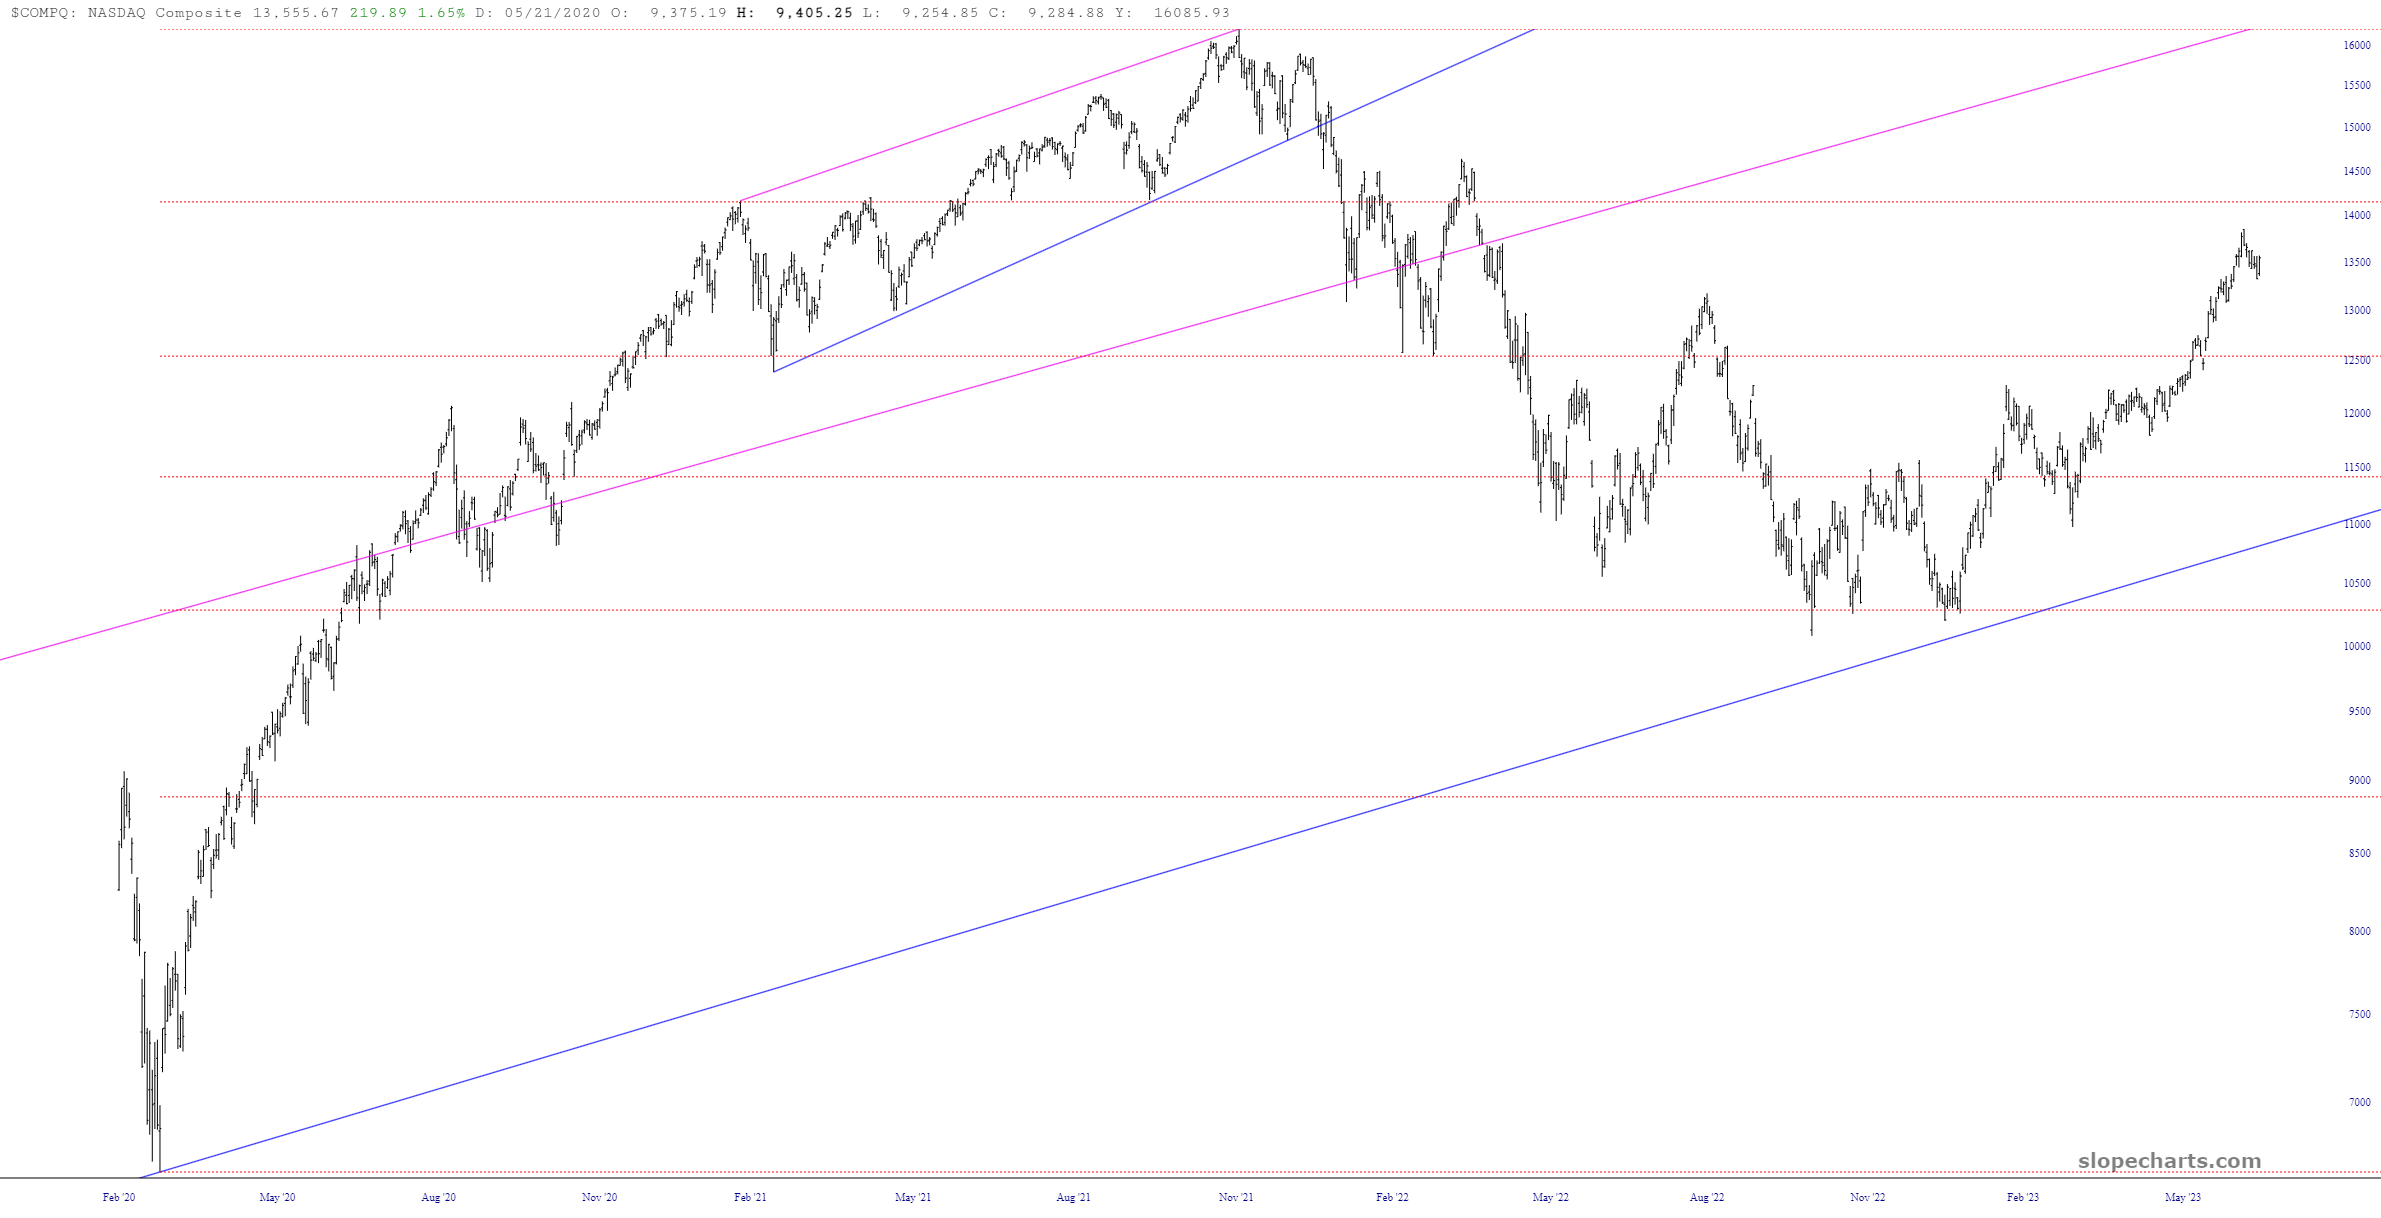
The NASDAQ Composite has been exceptionally strong all year long, although it has climbed rather close to a major Fibonacci resistance level.
(Click on image to enlarge)
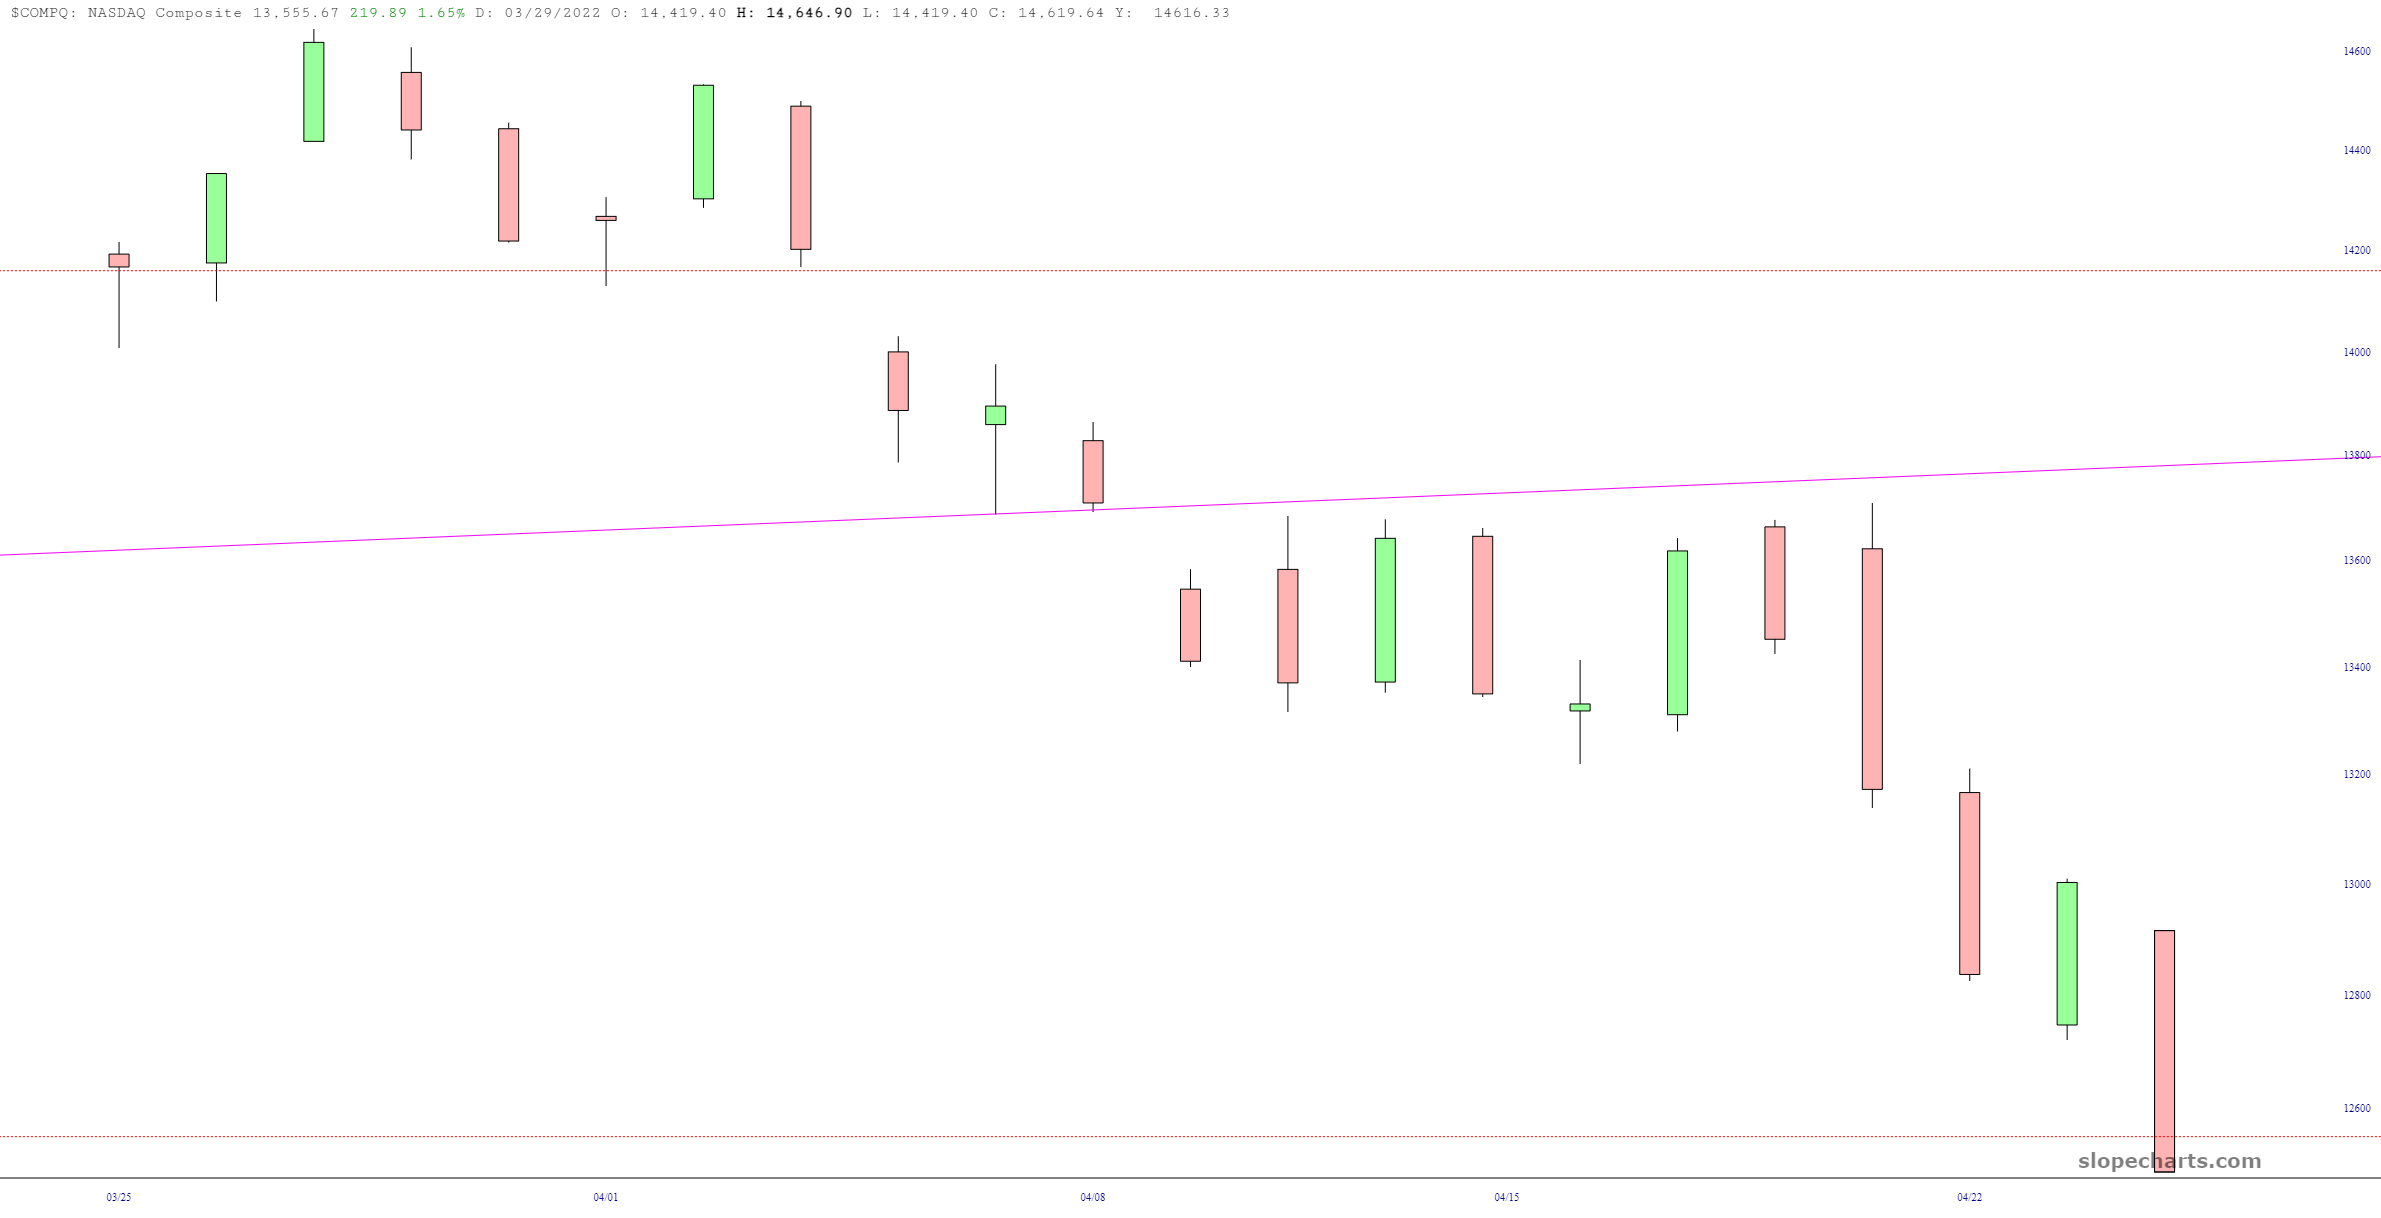
What’s interesting about this level (the red horizontal line) is that it also almost perfectly coincidences with a major price gap from April 2022.
(Click on image to enlarge)
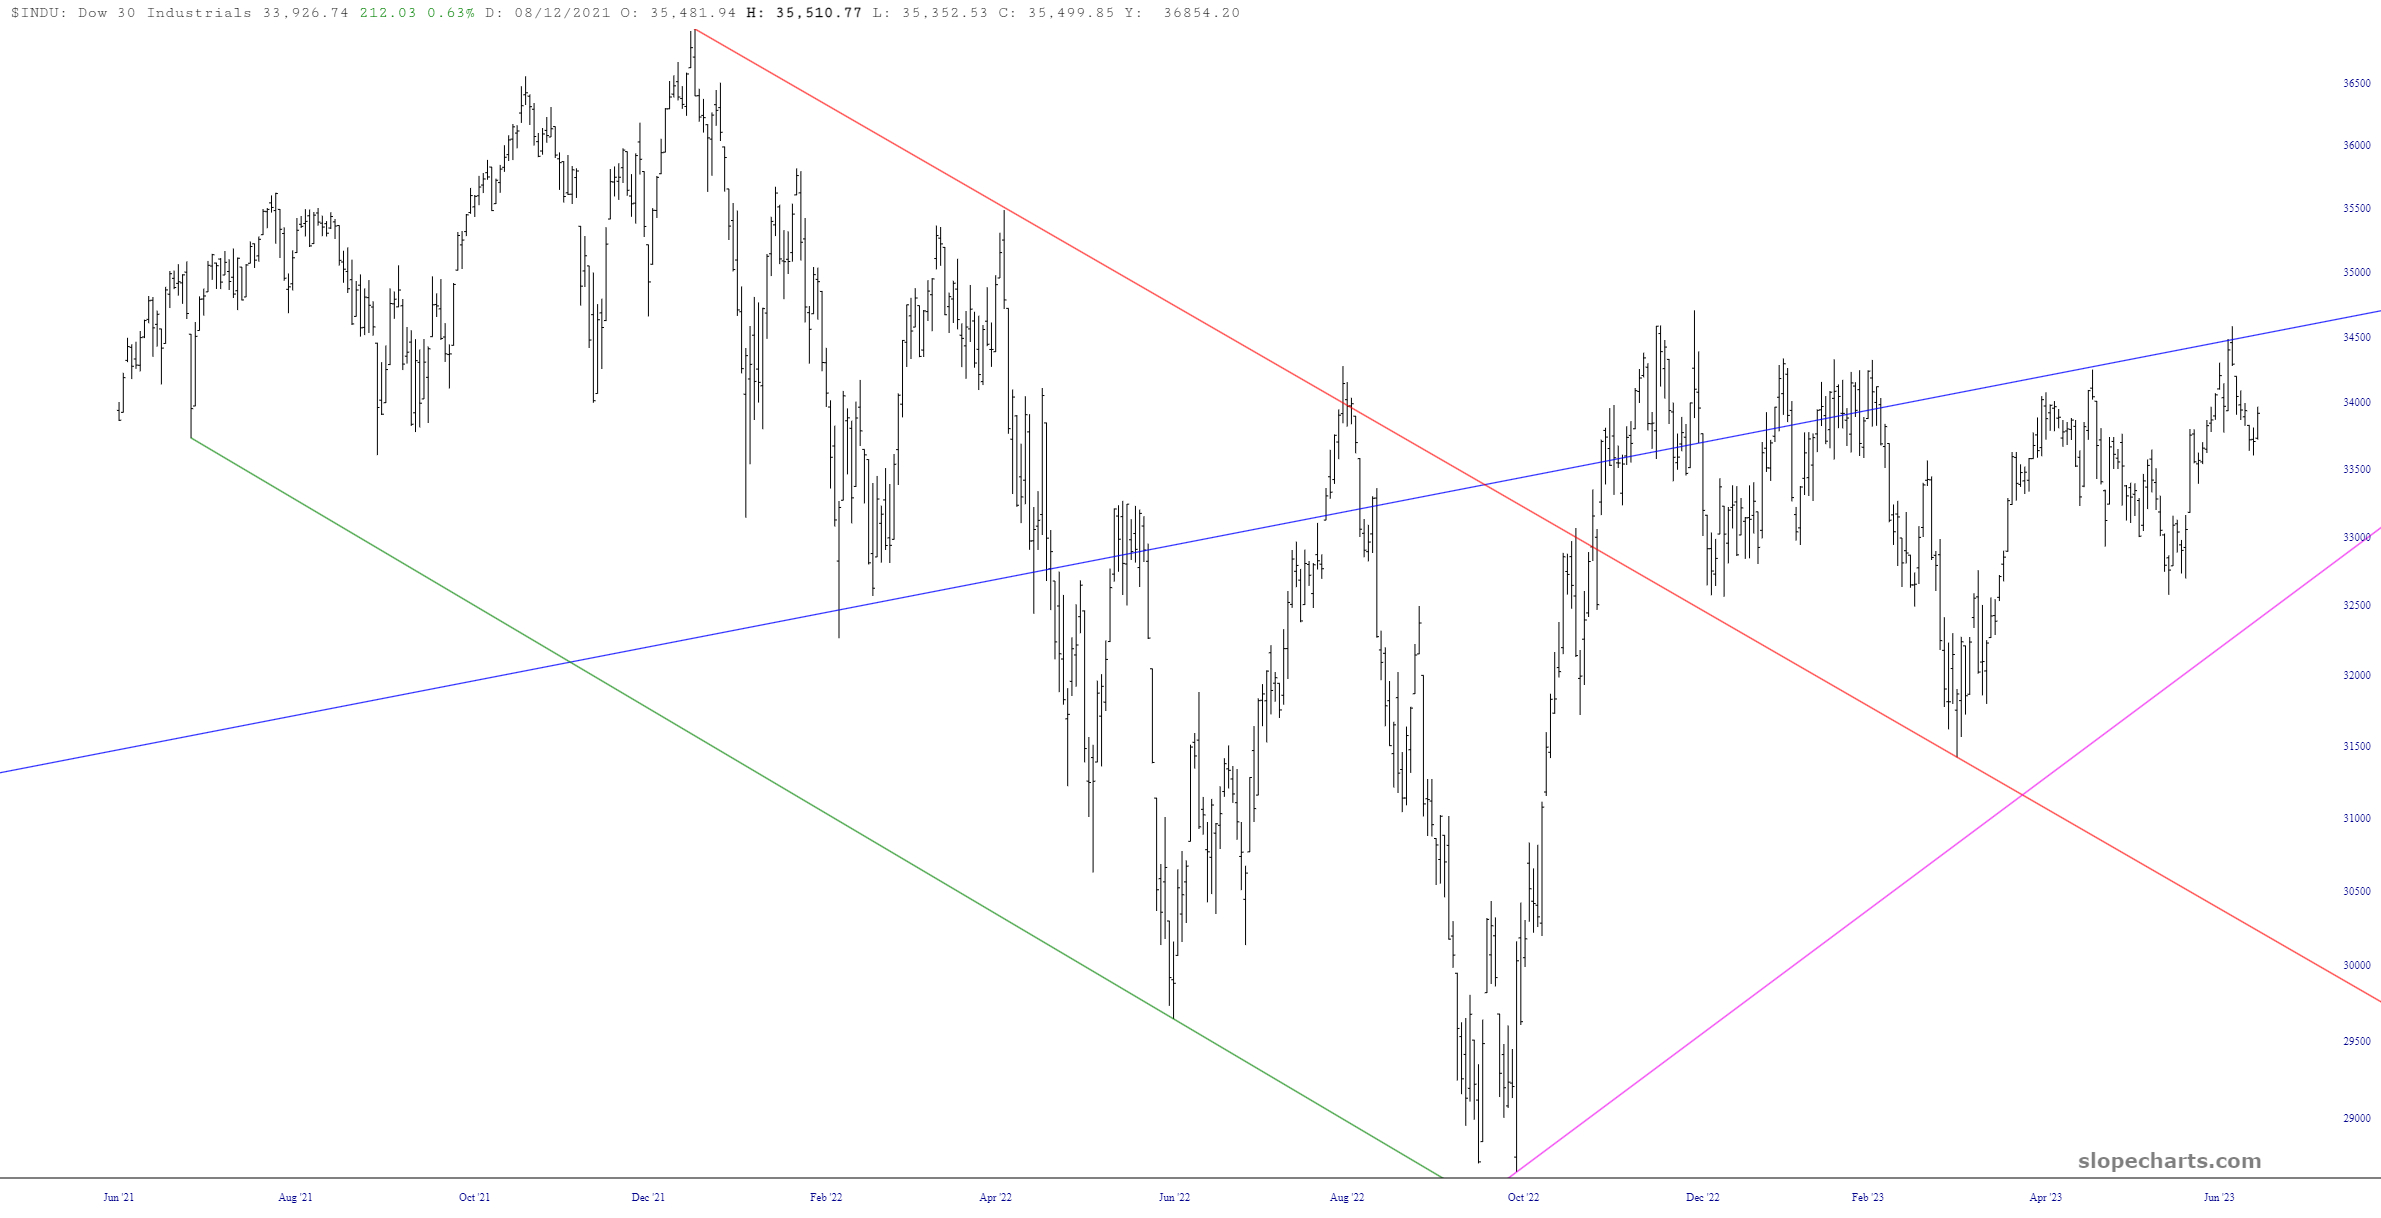
The Dow 30 Industrials is worth a close look. Take a look at the chart below, and you’ll see two broad phases. The first is, of course, the sell-off that lasted throughout most of 2022, terminating dramatically on October 13th (the low of this chart). At that point, an explosive rally took place. What’s interesting is two things: (a) the Dow has spent months doing nothing but digesting the gains of that rally; there’s been zero follow-through (b) if the prices weaken substantially enough, the Dow will snap its ascending trendline, thus terminating this counter-trend rally. Suffice it to say that the Dow’s glory days were measured in weeks, and there’s been a total loss of that momentum.
(Click on image to enlarge)
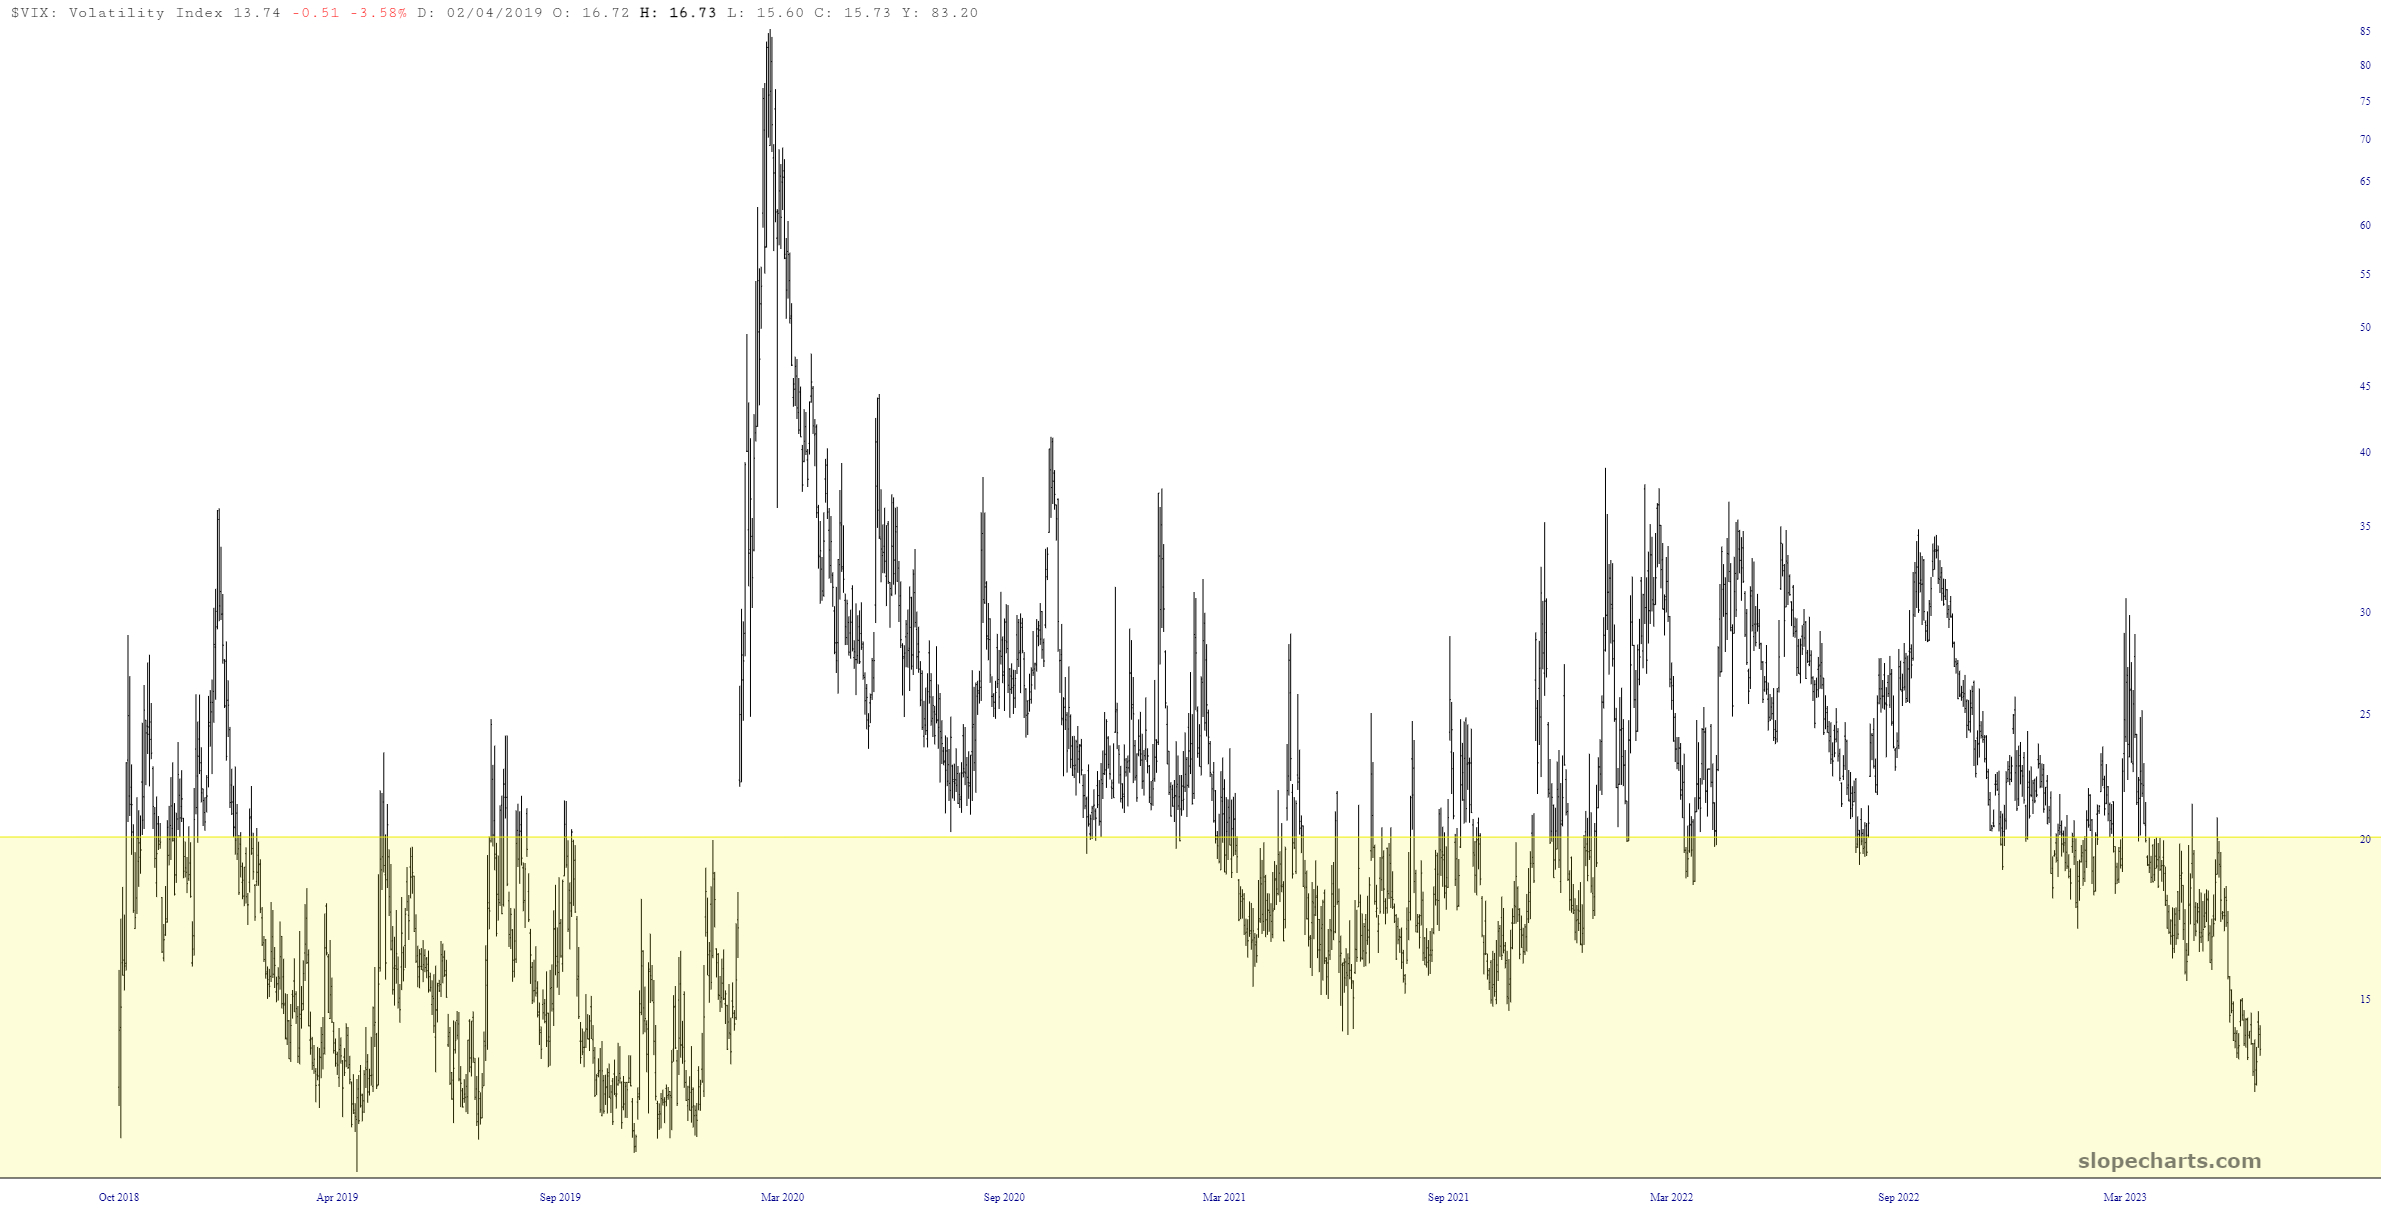
Naturally, however, with all the strength in 2023, volatility has been shriveling down to levels that are comic, at times even breaking beneath the teens. We are hammered down at 13 right now, and this complacency will hopefully get a powerful slap across the fact as we enter the second half of the year.
(Click on image to enlarge)
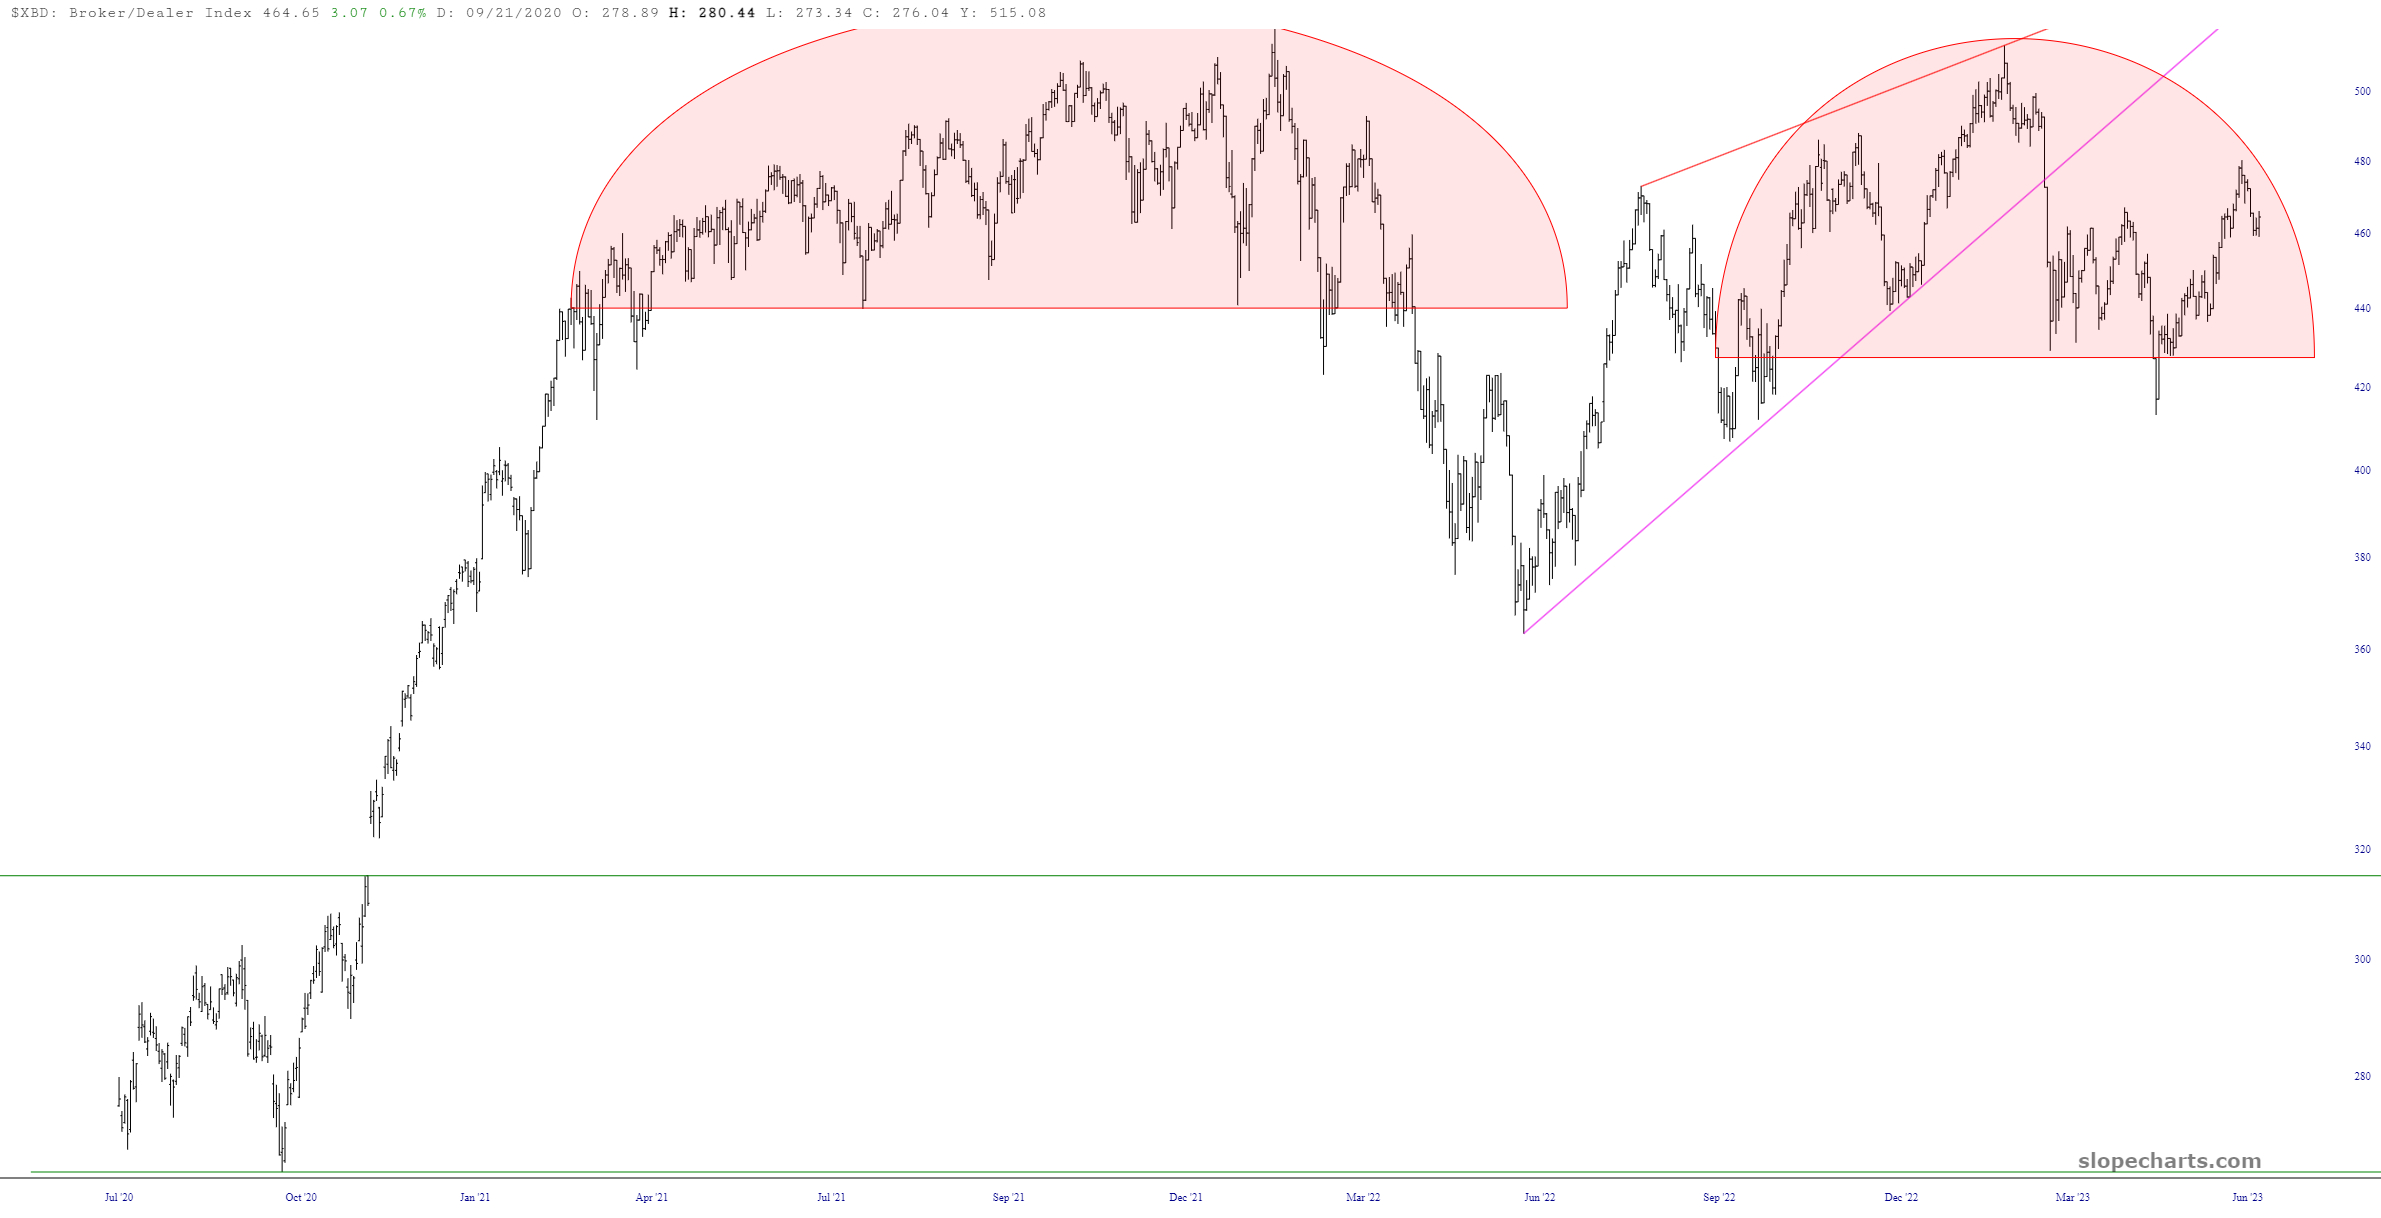
Lastly, although it isn’t as common an index to discuss in the mass media, the Broker/Dealer index is in a fascinating setup. This is an exceptionally well-formed head and shoulders top, and its price range beautifully matches the rounded top which took place before. XBD is a symbol worth watching.
(Click on image to enlarge)
More By This Author:

Comments
Log in or sign up to join the conversation.