FTSE And Hangseng Should Act As A Floor For The Indices
Indices sold off last week, while some Indices reached extreme Fibonacci extension areas from the highs in 3 or 7 swings, it remains to be seen whether correction in the Indices is over or will extend. Today, we will take a look at Elliott wave sequences in two Stock Markets like FTSE from UK and Hangseng from Hong Kong to determine if the downside in Indices is over or will extend more and will also present the most likely path along with the timing for the Indices to turn higher.
FTSE Incomplete Elliott Wave Sequence
(Click on image to enlarge)
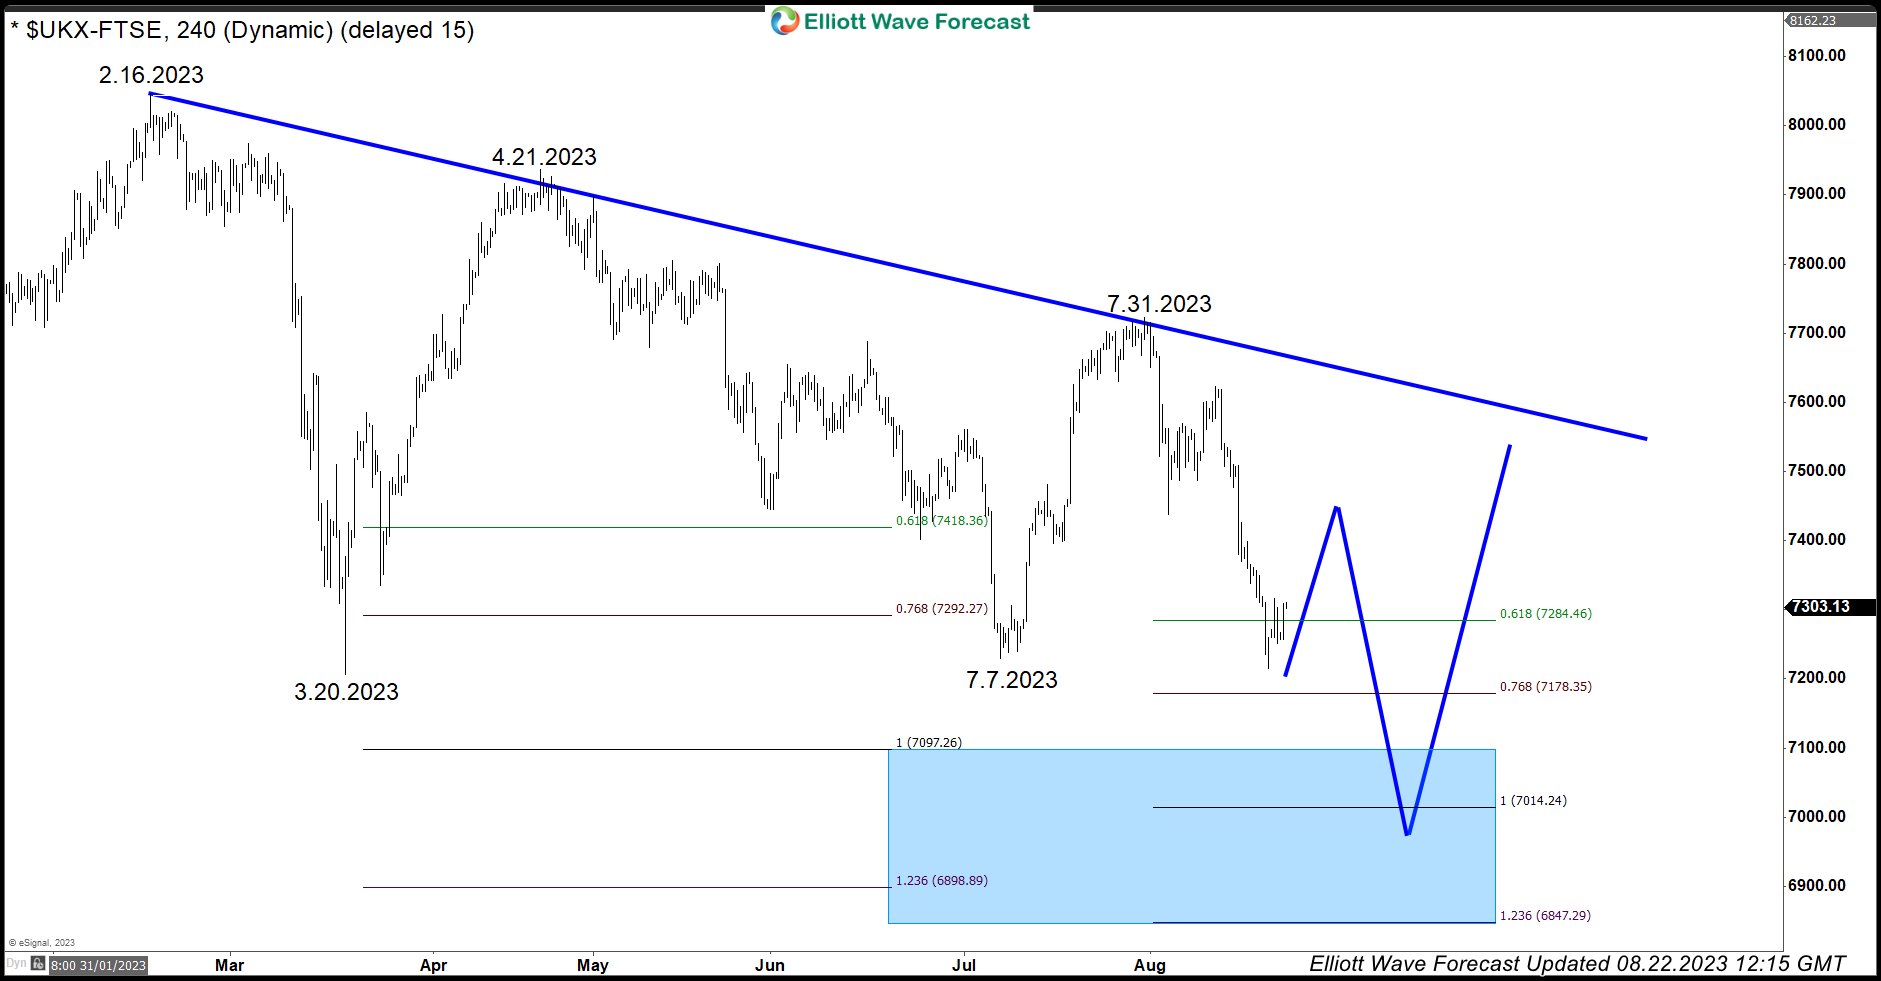
FTSE chart above shows the sequence of swings down from 2.16.2023 and 4.21.2023 highs respectively. FTSE selling since 7.31.2023 peak managed to break below 7.7.2023 peak and a break of this low has created an incomplete bearish sequence in the FTSE Index against 7.31.2023 peak. Even when it has not yet broken below 3.20.2023 low, 5 swings down from 4.21.2023 high means next bounce should fail below 7.31.2023 high for 1 more leg lower toward 7097.26 – 6847.29 area and hence why we think 3.20.2023 low will eventually give up. Ideal path is once cycle from 7.31.2023 high ends, a bounce in 3 or 7 swings to fail for 1 more leg lower.
Hangseng Incomplete Elliott Wave Sequence
(Click on image to enlarge)
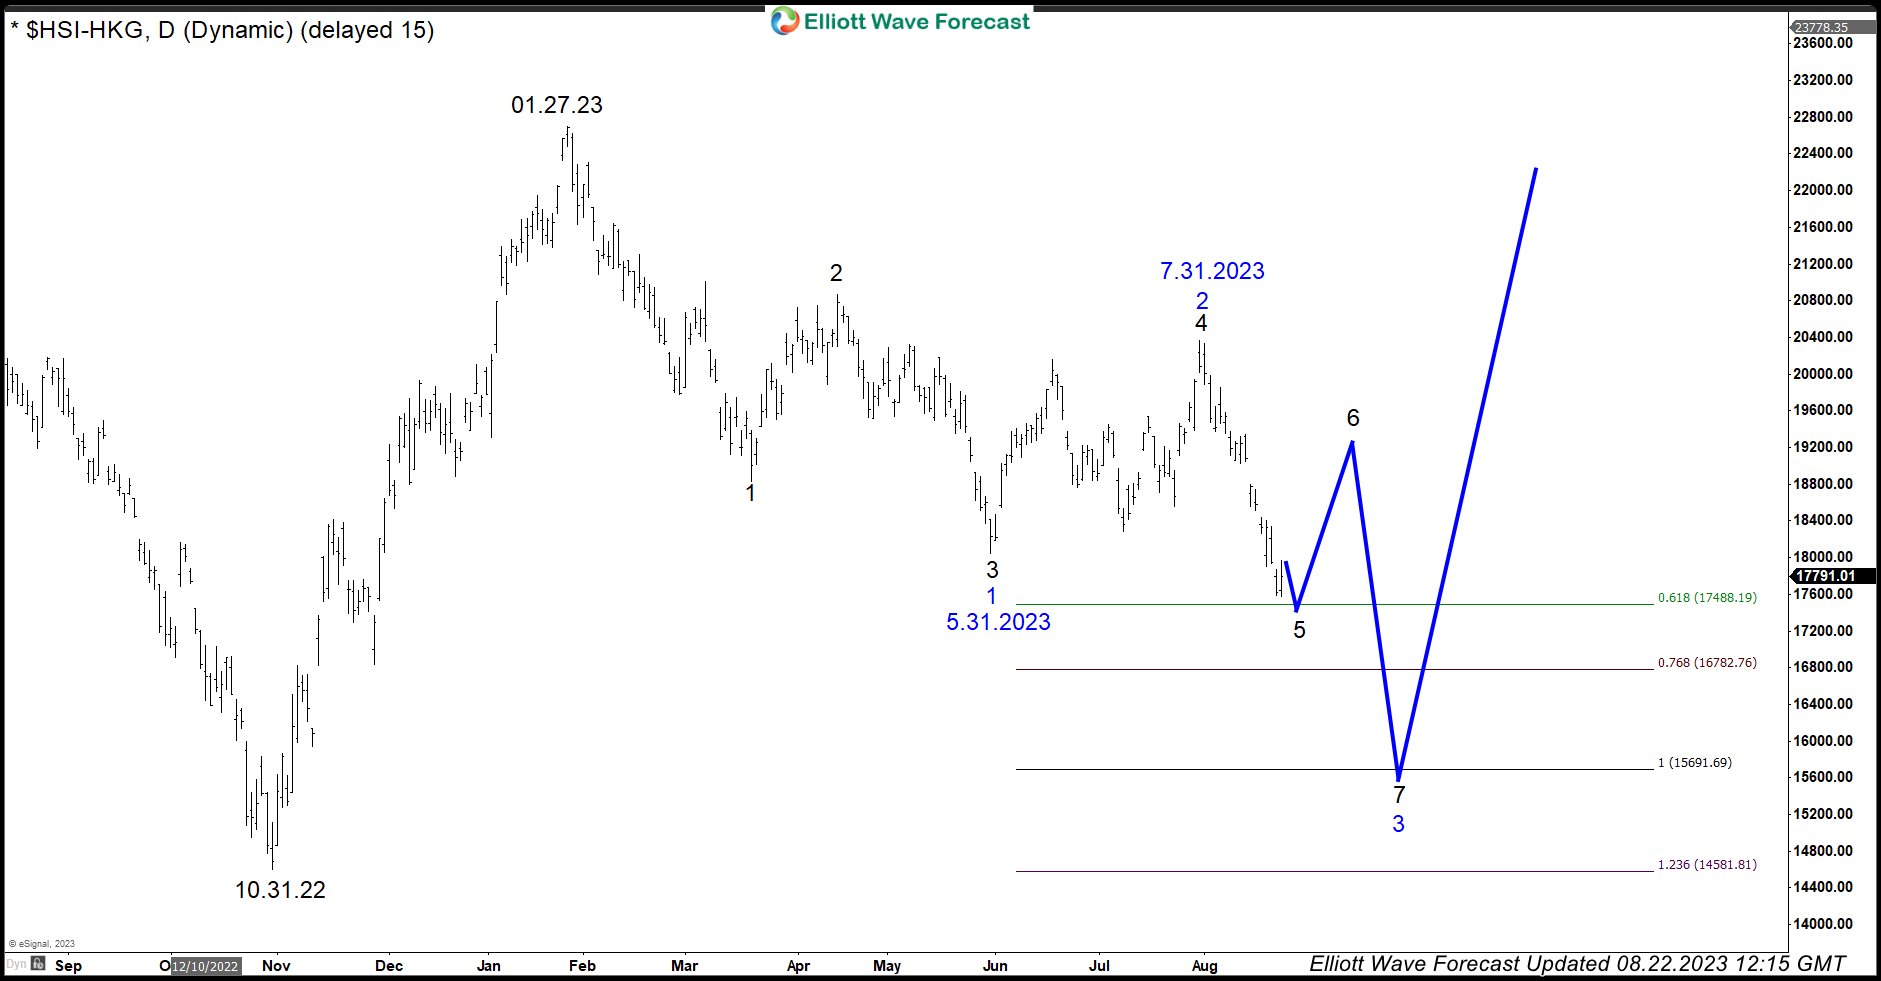
The chart above has Hangseng showing 5 swing down from 01.27.2023 peak which is an incompete bearish sequence against 7.31.2023 peak and calls for more downsided as far as 7.31.2023 high remains intact. Price is approaching 0.618 – 0.764 Fibonacci extension area (17488 – 16782) of the decline from 01.27.2023 peak to 5.31.2023 low projected lower from 731.2023 peak. This is the idea area to end 5th swing after which we expect a bounce to correct the decline from 7.31.2023 peak and then another leg lower toward 15691 – 14581 area to complete 7 swings sequence down from 01.27.2023 peak. Ideal path is once cycle from 7.31.2023 high ends, a bounce in 3 or 7 swings to fail for 1 more leg lower.
By looking at incomplete sequences in FTSE and Hangseng, it is easy to conclude that pull back in rest of the Indices should not be over yet, they should see a bounce to correct the decline from their respective July peaks followed by another leg lower. Extreme areas in FTSE ( 7097.26 – 6847.29 ) and Hangseng (15691 – 14581) should act as a floor and provide the timing for the Indices to turn higher again in a larger 3 waves at minimum.
More By This Author:
Ford Should Resume Lower After Sideways Movement EndsXLF Incomplete Sequences Calling The Drop Toward Blue Box Area
Eli Lilly & Company (LLY) Remains Supported In Bullish sequence
Disclaimer: Futures, options, and over the counter foreign exchange products may involve substantial risk and may not be suitable for all investors. Leverage can work against you as well as for ...
more


