
Four Most Oversold Dow Stocks
With the stock market’s positive close on Friday, October 11, the Dow Jones Industrial Average recorded its first higher close in the past four weeks, up 0.91%. Just over a week ago, the Dow Jones Industrial Average had dropped as low as 25,743, but closed Friday at 26,816.
The encouraging news regarding the U.S.-China trade talks has given investors a reason to be more optimistic on the outlook for stock prices. Given last week’s American Association of Individual Investors survey, in which only 20.3% of investors were bullish while 44.0% were bearish, there is clearly room for more positive sentiment.
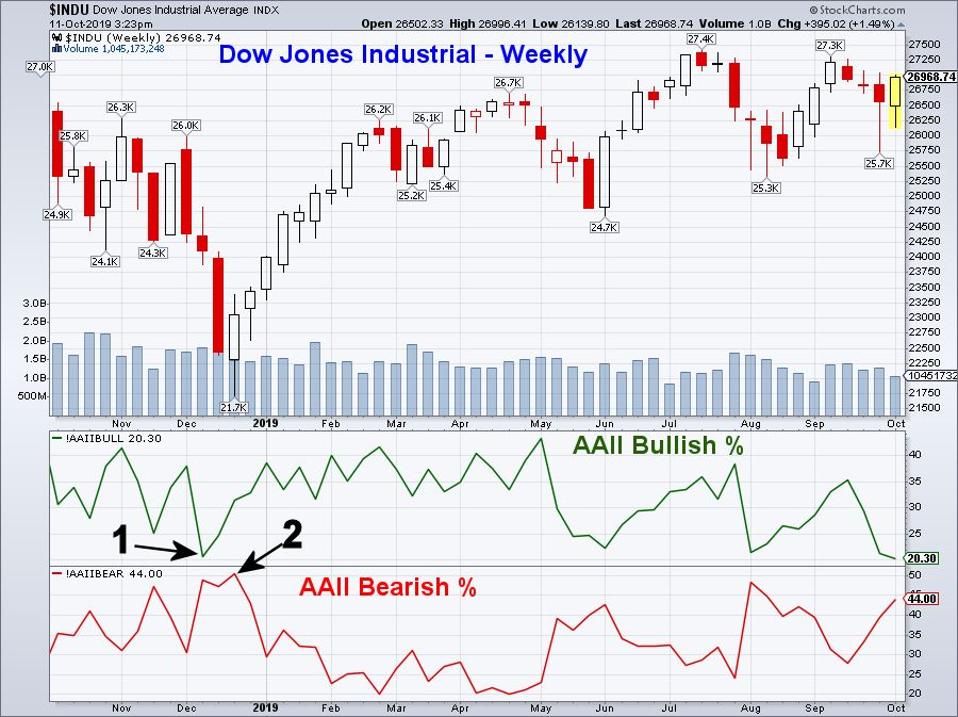
Chart via TomAspray-ViperReport.com
The bullish% last week was lower than the December 13, 2018 reading of 20.9% (point 1). Some will recall that the stock market reached its low almost two weeks later on December 26, 2018. The bearish% peaked as stocks were making their low the week of December 27th at 50.3% (point 2). A bottoming-out of the bullish% sometimes precedes an upward turn in the market by a few weeks, while bearish% sometimes tops out concurrently (or later) than an upward turn in prices. Keep an eye on investor sentiment, but don't establish any positions based on sentiment alone.
With Friday’s strong close, there is the potential for the stock market to rally further, if a trade deal is signed. Do any of the most oversold stocks in the Dow Jones Industrial Average look attractive for new purchase?
As part of my regular stock market analytical routine, I look at where the 30 Dow stocks closed the week in relation to their starc bands. When a stock or ETF closes near its upper starc band (starc+), it is considered to be a high-risk buy and therefore overbought. Conversely, a close near the lower starc band (starc-) indicates that a stock is in a high-risk sell area (or a low-risk buy area), and is oversold.
These bands were originally developed by Manning Stoller to identify price extremes and predict future stock action: when either weekly band is reached, then a move in the opposite direction has a higher probability. Therefore, when a positive signal is observed near the starc- band, the risk involved in buying is lower, and the potential reward is usually higher. These bands work equally well on all data time frames.
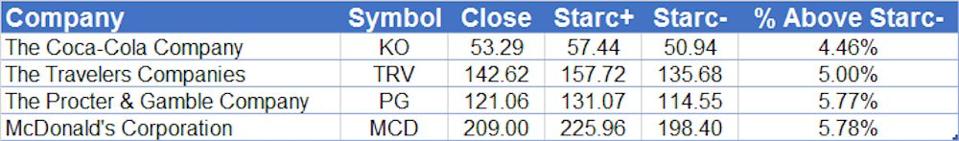
Chart via TomAspray-ViperReport.Com
Of course, that does not mean that an overbought stock can’t go higher or an oversold stock can’t go lower. Therefore, once I have the scan results, I look at how the stocks are performing versus the S&P 500, and also analyze their weekly volume patterns. Listed in the chart above are the four most oversold stocks, based on a starc band analysis as of the end of this past week.
KO chart vit TomAspray-ViperReport.Com
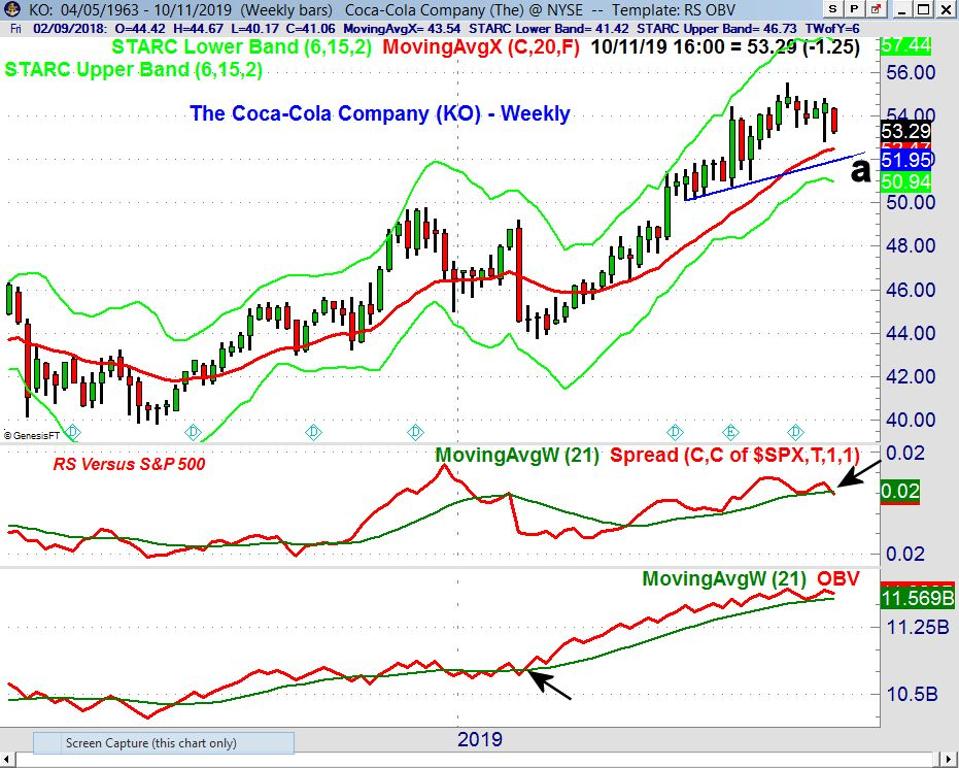
The Coca-Cola Company (KO) was down 2.3% last week, but closed above the prior week’s low of $52.82. Its 20-week Exponential Moving Average (EMA) is at $52.47 with chart support (line a) at $51.95. The weekly starc- band is at $50.94 which is 4.46% below Friday’s close.
The weekly technical studies for KO are now mixed. The relative performance (RS) has closed below its Weighted Moving Average (WMA) but it is still rising slightly. The On Balance Volume (OBV) has been above its WMA since February 22, when KO closed at $44.60. The OBV is still above its WMA and more importantly, the OBV is still rising. A daily close above $54.78 would be a short term positive.
TRV chart via TomAspray-ViperReport.Com
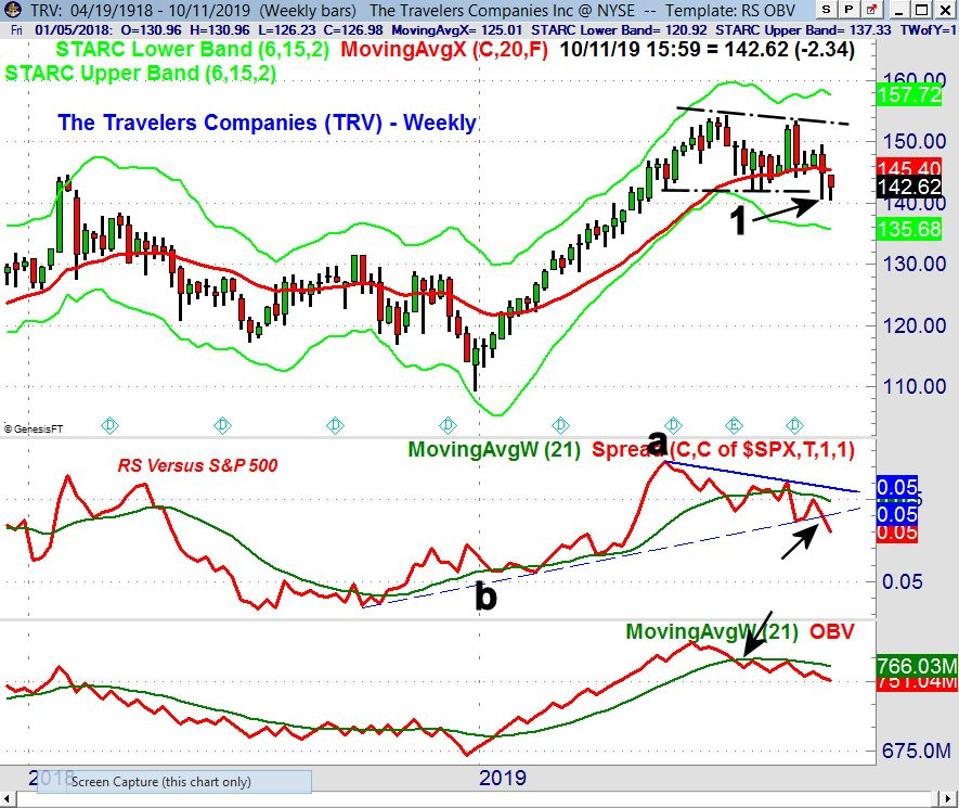
Two weeks ago, the Travelers Company (TRV) dropped below support going back to May at $142.27 (point 1). The 38.2% support from the late 2018 low of $109. 23 is at $137.04. The weekly starc- band is at $135.68, which is 5% below Friday’s close. There is initial resistance now at $145.50, and the 20-week EMA with stronger resistance at $149.58.
The RS turned negative in early September and dropped below support (line b) in early September, which was another sign of weakness. The OBV had turned negative at the start of August when it dropped below its declining WMA. The OBV declined further last week.
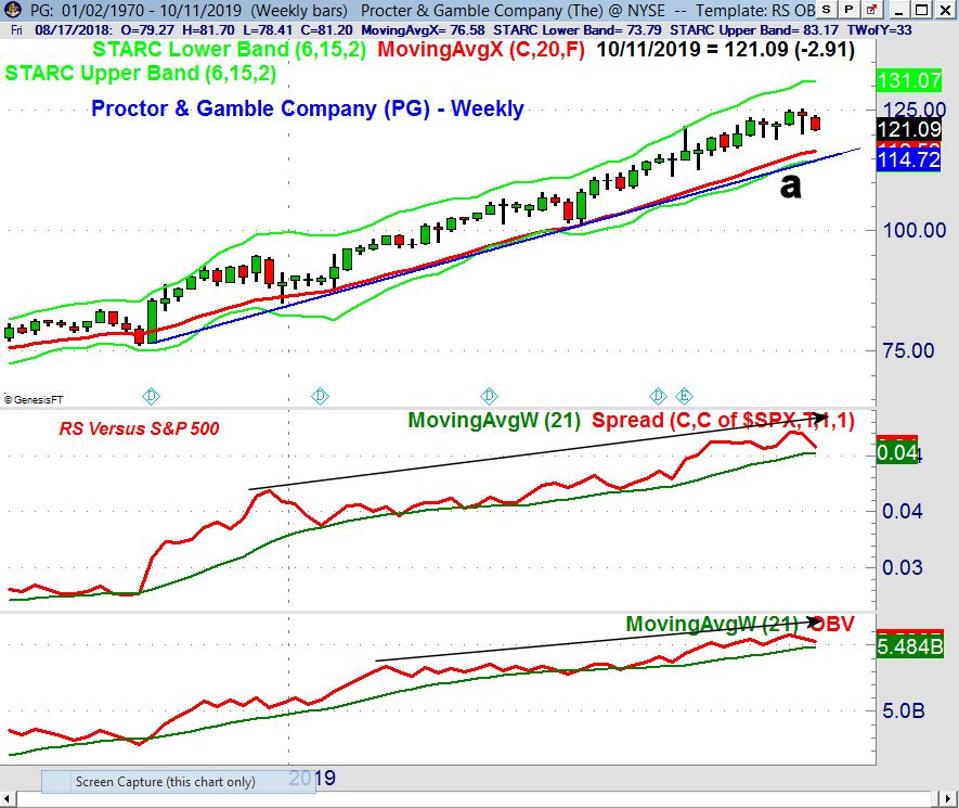
PG chart via TomAspray-ViperReport.Com
Proctor & Gamble Company (PG) was down 2.3% last week, while the S&P 500 was up 0.62%. PG had a low of $120.21 on October 2, with the rising 20-week EMA at $116.56. The weekly uptrend from the October 2018 low is at $114.72 (line a), which is quite close to the weekly starc- band at $114.68. PG made an all-time high of $125.36 on September 30 which is now key resistance.
The weekly studies are positive, but have declined from the new highs made at the end of September. The RS surged above its WMA in October of 2018 as PG started to outperform the S&P 500. It shows a pattern of higher highs and is still above its WMA. The OBV has also declined from the high made two weeks ago, but is still positive.
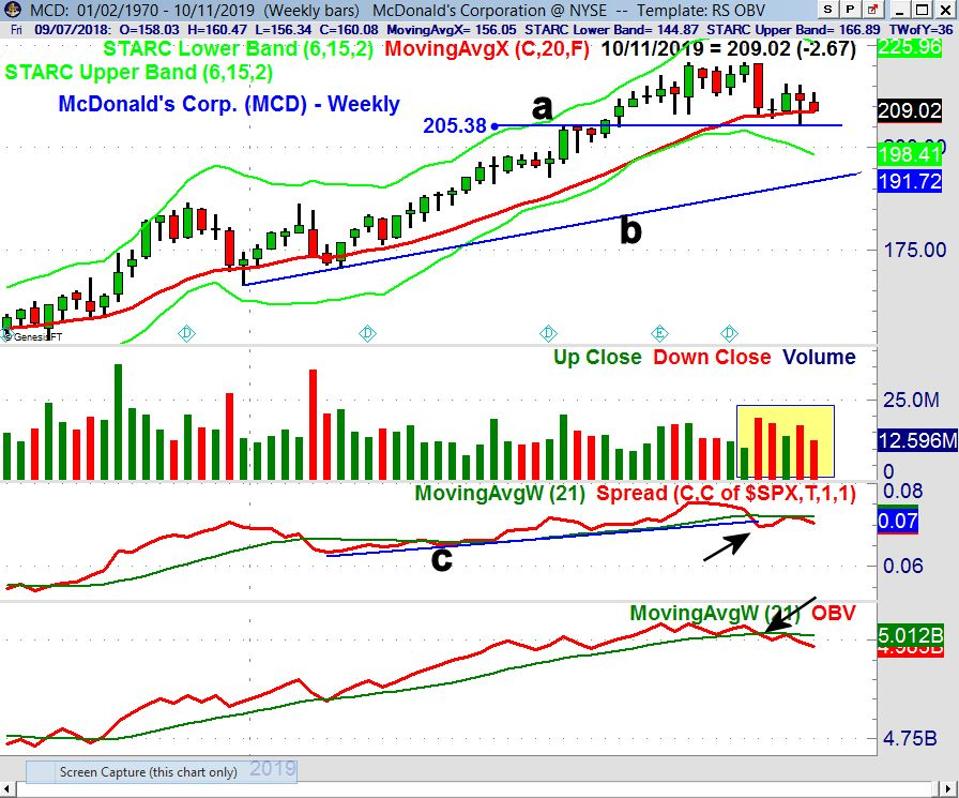
MCD chart via TomAspray-ViperReport.Com
McDonald’s Corp. (MCD) was down 2.39% on Friday, and the volume was higher than the 30-day average. MCD looks ready to test the October 2 low at $205.38 (line a). The weekly starc- band is 5.78% below the weekly close at $198.40. The longer term uptrend (line b) is at $191.72. There is weekly resistance at $215.36-67.
The RS dropped below support (line c) on September 13, and the WMA has flattened out. The weekly OBV looks more negative, as it rebounded back to its flat WMA three weeks ago before dropping below the prior lows. The volume spiked five weeks ago, coinciding with a sharp drop in prices, and has remained high since, which validates the selling.
Of these four stocks, the weekly analysis is currently only positive on Proctor & Gamble Company (PG) which is therefore the most attractive of the most oversold Dow stocks. The weekly studies are mixed on the Coca-Cola Company (KO), so it also deserves watching.
The daily technical studies are negative on all four stocks, so one should be waiting for the daily studies to turn positive on KO and PG before establishing any new long positions..
If you like this type of stock analysis, you might consider the Viper Hot Stocks Report which provides specific ...
more


$PG oversold? It is about $2 from the all time high and it’s oversold?