Fortinet Stock Signal: More Downside After Earnings Miss?
Short Trade Idea
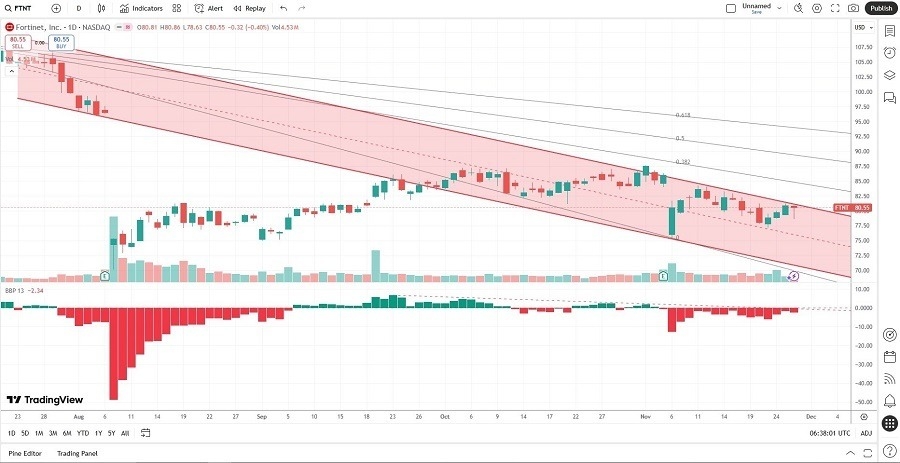
Enter your short position between $77.17 (the intra-day low of its three-day reversal) and $81.19 (the intra-day high of its last bullish candlestick).
Market Index Analysis
- Fortinet (FTNT) is a member of the Nasdaq 100 and the S&P 500 indices.
- Both indices resume their recovery but are climbing the same wall of worry as before the sell-off.
- The Bull Bear Power Indicator of the Nasdaq 100 Index turned bullish but features a descending trendline.
Market Sentiment Analysis
Equity markets rallied for a fourth session following last week’s sell-off to finish the holiday-shortened trading session higher. Investors piled into AI stocks and reversed their opinion on another 25 basis points of interest rate cut. With consumer confidence low, investors will pay attention to Black Friday to gauge activity. It is no longer a one-time sales event of the past, but it still provides valuable insights into consumer behavior. Markets ignore claims of circular financing against NVIDIA, and the AI bubble discussion continues to attract opinions on both sides.
Fortinet Fundamental Analysis
Fortinet is a cybersecurity company with offices in dozens of countries. It ranks among the top-rated large-cap growth stocks and expands its market share via acquisitions.
So, why am I bearish on FTNT after its earnings release?
Revenues of $1.72 billion topped estimates of $1.70 billion, but fourth-quarter guidance was soft. I remain bearish on FTFN as service revenue growth decelerated for the ninth consecutive quarter, the US growth rate was weaker than that of other regions, and valuations remain high. Its future earnings and growth prospects appear limited, and I see the current downside trajectory extending.

Fortinet Fundamental Analysis Snapshot
The price-to-earning (P/E) ratio of 33.15 makes FTNT an expensive stock. By comparison, the P/E ratio for the Nasdaq 100 Index is 33.89.
The average analyst price target for FTNT is $87.45. It exhibits moderate upside potential, while downside risks dominate.
Fortinet Technical Analysis
Today’s FTNT Signal
(Click on image to enlarge)

Fortinet Price Chart
- The FTNT D1 chart shows price action descending inside a bearish price channel.
- It also shows price action between its descending 0.0% and 38.2% Fibonacci Retracement Fan levels.
- The Bull Bear Power Indicator is bearish with a descending trendline.
- The average bearish trading volumes are higher than the average bullish trading volumes.
- FTNT corrected as the Nasdaq 100 Index rebounded, a significant bearish development.
My Call on Fortinet
I am taking a short position in FTNT between $77.17 and $81.19. Nine quarters of declining service revenue growth, high valuations, and an uncertain outlook suggest more selling within its months-long bearish price channel.
- FTNT Entry Level: Between $77.17 and $81.19
- FTNT Take Profit: Between $54.57 and $59.07
- FTNT Stop Loss: Between $86.32 and $87.66
- Risk/Reward Ratio: 2.47
More By This Author:
EUR/USD Forex Signal: More Bullish As USD DeclinesAUD/USD Forex Signal: More Bullish But $0.6519 Looks Strong
GBP/USD Forex Signal: Bulls Test $1.3128
Risk Disclaimer: DailyForex will not be held liable for any loss or damage resulting from reliance on the information contained within this website including market news, analysis, trading signals ...
more


