
Focusing On The Retail Sector As Q4 Earnings Season Winds Down

Image: Bigstock
Walmart’s (WMT - Free Report) quarterly report showed that it was able to work through the supply-chain challenges and keep its shelves fully stocked.
Walmart had to spend more to keep shelves stocked and stores staffed, with supply-chain costs coming in $400 million more than it had budgeted, with the Omicron surge significantly adding to its Covid-specific paid-leave costs. As had been the case in the preceding period, Walmart benefited from +26% more inventory on hand during the reported quarter.
The market appreciated Walmart’s ability to navigate this difficult operating environment in an otherwise robust consumer-spending backdrop, as the January Retail Sales report showed. It will be interesting to see if retail operators like Home Depot (HD), Lowe’s (LOW), Macy’s (M) and others that are reporting results this week will get the same treatment.
With respect to the Retail sector 2021 Q4 earnings season scorecard, we now have results from 20 of the 34 retailers in the S&P 500 index. Total Q4 earnings for these retailers are up +53.6% from the same period last year on +7.5% higher revenues, with 80% beating EPS estimates and an equal proportion beating revenue estimates. The comparison charts below put the Q4 beats percentages for these retailers in a historical context.
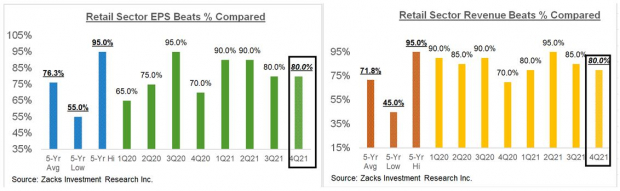
Image Source: Zacks Investment Research
With respect to the earnings and revenue growth rates, Amazon’s blockbuster numbers play a significant role in the strong year-over-year growth rate for the sector (Amazon is part of the Zacks Retail sector and not the Zacks Technology sector). The two comparison charts below show the Q4 earnings and revenue growth relative to other recent periods, both with Amazon’s results (left side chart) and without Amazon’s numbers (right side chart).
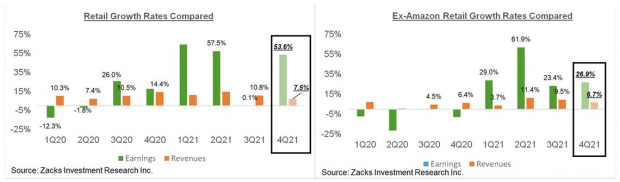
Image Source: Zacks Investment Research
This Week’s Reporting Docket
We have more than 700 companies on deck to report results this week, including 53 S&P 500 members. Notable companies reporting this week, aside from the aforementioned retailers, are Live Nation Entertainment (LYV), Bookings Holdings (BKNG), Medtronic (MDT), and others.
Q4 Earnings Season Scorecard
Including all the results that came out through Friday, February 18th, we now have Q4 results from 420 S&P 500 members or 84% of the index’s total membership. Total earnings (or aggregate net income) for these 420 companies are up +30.6% from the same period last year on +15.6% lower revenues, with 77.4% beating EPS estimates and 78.3% beating revenue estimates.
The two sets of comparison charts below put the Q4 results from these 420 index members in a historical context, which should give us a sense how the Q4 earnings season is tracking at this stage relative to other recent periods.
The first set of charts compare the earnings and revenue growth rates for these 420 index members.
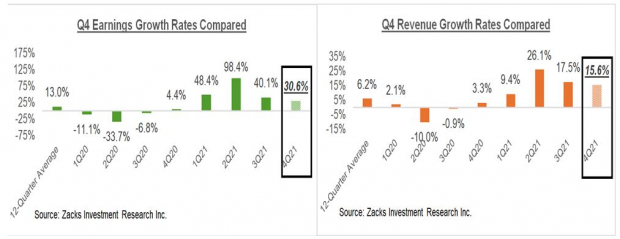
Image Source: Zacks Investment Research
The second set of charts compares the proportion of these 420 index members beating EPS and revenue estimates.
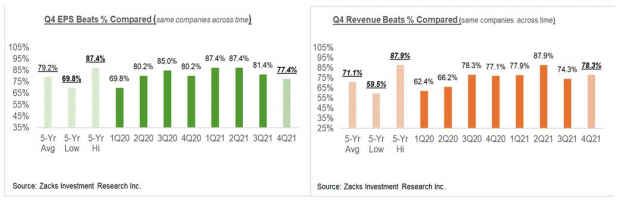
Image Source: Zacks Investment Research
As you can see from the above comparison, the Q4 numbers not only represent a growth deceleration from the pace of the first three quarters of the year, but also in terms of the beats percentages, particularly EPS beats percentages.
In fact, Q4 revenue beats exceed the Q4 EPS beats percentage. The most logical explanation for this anomaly is the impact of ongoing inflationary trends and other logistical bottlenecks that appear to have been bigger headwinds than analysts had been expecting. Revenues remain strong, a reflection of continued strong demand, but margins have been under pressure as a result of a bigger than expected rise in costs.
Expectations for Q4 & Beyond
Looking at the quarter as a whole, combining the actual results that have come out with estimates for the still-to-come companies, total Q4 earnings for the S&P 500 index are expected to be up +31.7% from the same period last year on +15.2% higher revenues.
The chart below presents the earnings and revenue growth picture on a quarterly basis, with expectations for 2021 Q4 contrasted with the actual growth achieved over the preceding four quarters and estimates for the following three.
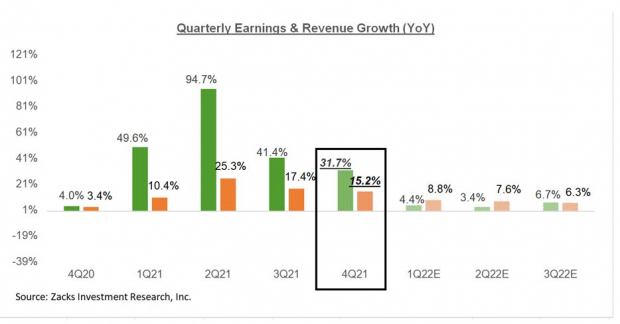
Image Source: Zacks Investment Research
Please note that while the year-over-year earnings growth rate has been coming down, the overall dollar value of earnings remains very high. In fact, the aggregate earnings total for 2021 Q4 is on track to reach a new all-time quarterly record, as the chart below shows.
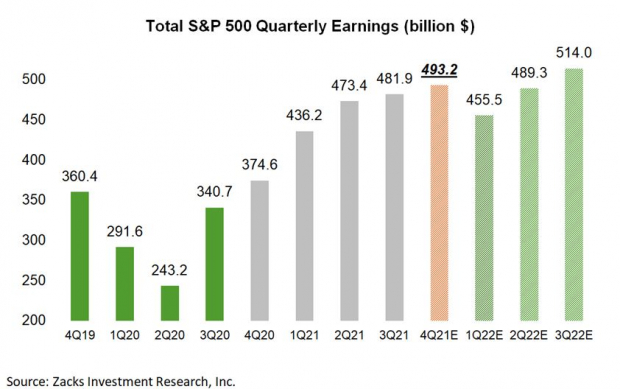
Image Source: Zacks Investment Research
For the current period, total S&P 500 earnings are expected to increase +4.4% from the same period last year on +8.4% higher revenues. The chart below shows the revisions trend for the current period.
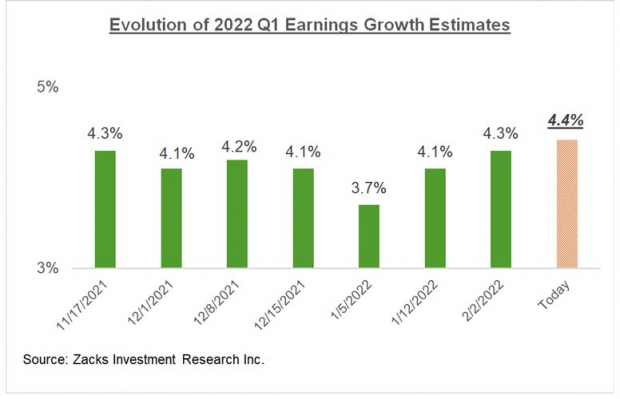
Image Source: Zacks Investment Research
The chart below shows the comparable picture on an annual basis.
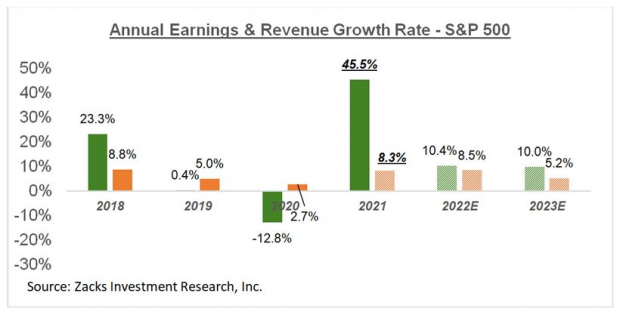
Image Source: Zacks Investment Research
Disclosure: Zacks.com contains statements and statistics that have been obtained from sources believed to be reliable but are not guaranteed as to accuracy or completeness. References to any specific ...
more

