
Fill Up Your Cart With Costco
Summary
- 88% technical buy signals.
- 18 new highs and up 7.23% in the last month.
- 28.71% gain in the last year.
The Barchart Chart of the Day belongs to the retail wholesaler Costco (Nasdaq: COST). I sorted Barchart's All Time High list first by the highest number of new highs in the last month, then used the Flipchart function to review the charts for consistent price appreciation. Since the Trend Spotter signaled a buy on 6/21 the stock gained 2.26%.
Costco Wholesale Corporation, together with its subsidiaries, engages in the operation of membership warehouses in the United States, Puerto Rico, Canada, the United Kingdom, Mexico, Japan, Korea, Australia, Spain, France, Iceland, China, and Taiwan. It offers branded and private-label products in a range of merchandise categories. The company provides dry and packaged foods, and groceries; snack foods, candies, alcoholic and nonalcoholic beverages, and cleaning supplies; appliances, electronics, health and beauty aids, hardware, and garden and patio products; meat, bakery, and deli products, as well as produce; and apparel and small appliances. It also operates pharmacies, optical dispensing centers, food courts, and hearing-aid centers, as well as 615 gas stations; and offers business delivery, travel, same-day grocery, and various other services online in various countries. As of October 07, 2020, the company operated 796 warehouses, including 552 in the United States and Puerto Rico, 102 in Canada, 39 in Mexico, 29 in the United Kingdom, 27 in Japan, 16 in South Korea, 13 in Taiwan, 12 in Australia, 3 in Spain, 1 in Iceland, 1 in France, and 1 in China. It also operates e-commerce websites in the United States, Canada, the United Kingdom, Mexico, South Korea, Taiwan, Japan, and Australia. The company was formerly known as Costco Companies, Inc. and changed its name to Costco Wholesale Corporation in August 1999. Costco Wholesale Corporation was founded in 1976 and is based in Issaquah, Washington.
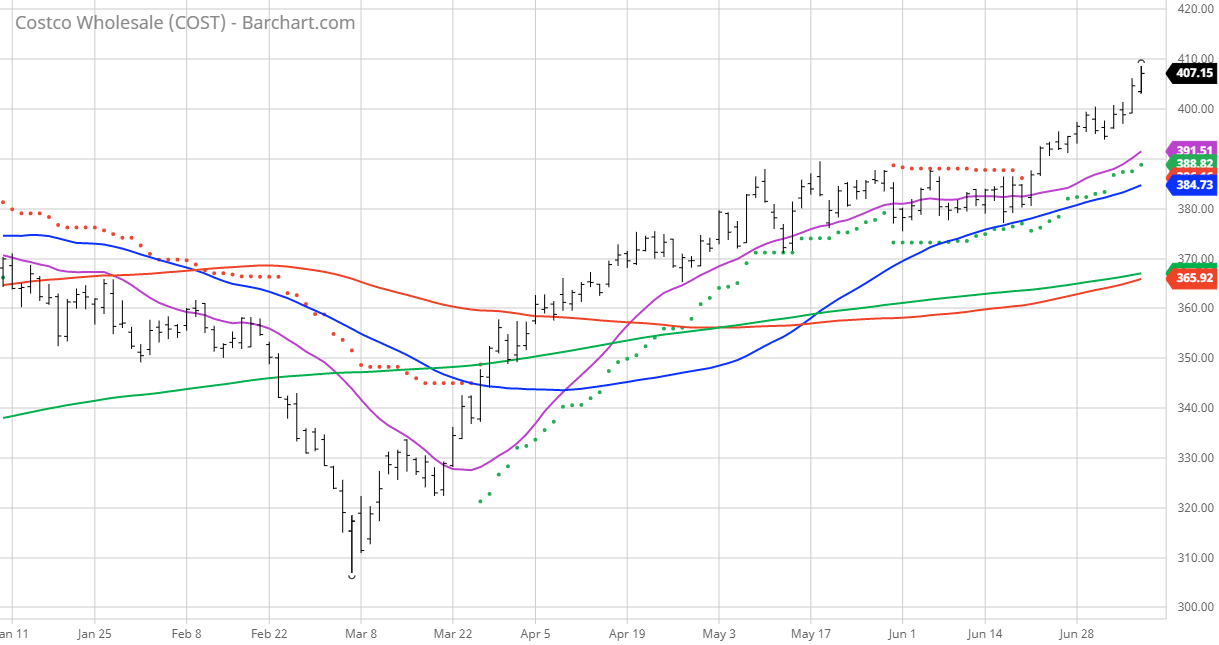
Barchart technical indicators:
- 88% technical buy signals
- 26.30+ Weighted Alpha
- 28.71% gain in the last year
- Trend Spotter buy signal
- Above its 20, 50 and 100 day moving averages
- 18 new highs and up 7.23% in the last month
- Relative Strength Index 71.76%
- Technical support level at 403.99
- Recently traded at 407.15 with a 50 day moving average of 384.73
Fundamental factors:
- Market Cap $178.90 billion
- P/E 38.69
- Dividend yield .79%
- Revenue expected to grow 15.20% this year and another 7.20% next year
- Earnings estimated to increase 20.80% this year, an additional 8.30% next year and continue to compound at an annual rate of 10.47% for the next 5 years
- Wall Street analysts issued 15 strong buy, 8 buy, 9 hold and 2 underperform recommendation on the stock
- The individual investors following the stock on Motley Fool voted 5,160 to 177 that the stock will beat the market
- 175,770 investors are monitoring the stock on Seeking Alpha
Disclosure: I/we have no stock, option or similar derivative position in any of the companies mentioned, but may initiate a beneficial Long position through a purchase of the stock, or the ...
more

