
Industry-leading operational metrics, excellent profit margins, and a stable outlook form a solid platform for a price action reversal. Should you fasten your portfolio?
Long Trade Idea
Enter your long position between 39.05 (the intra-day low of a medium horizontal support level) and 40.64 (yesterday’s intra-day high).
Market Index Analysis
- Fastenal (FAST) is a member of the NASDAQ 100 and the S&P 500.
- Both indices have entered a bearish price channel and are moving away from all-time highs with rising bearish volumes.
- The Bull Bear Power Indicator of the S&P 500 is bearish with a descending trendline.
Market Sentiment Analysis
Equity markets extended the AI-led sell-off from last week, with futures pointing to more downside ahead of tomorrow’s NVIDIA earnings after the bell. Markets also slashed expectations for a December interest rate cut from above 90% to 40%, further applying downside pressure on tech names, as they often rely on debt to finance business expansions. Adding to the sour mood is the bear market in Bitcoin and the impact on investor confidence, especially in the retail sector. While it remains premature to call the AI bubble bursting, red flags continue to amass.
Fastenal Fundamental Analysis
Fastenal is an industrial supply and stock-keeping unit with over 690,000 items. It refers to itself as a supply chain solutions company. It primarily caters to the construction and manufacturing sectors.
So, why am I bullish on FAST despite its post-earnings slump?
While third-quarter revenues of $2.13 billion and earnings per share of $0.29 met expectations, shares experienced an overdone sell-off. Valuations remain lofty, but I am bullish on its industry-leading returns on assets and invested capital. FAST has excellent profit margins, and its recent investment plans show confidence in its future, including low-double-digit earnings-per-share growth. Adding to my bullish case is the superb capital position and dividend stability.
Fastenal Fundamental Analysis Snapshot
|
Metric |
Value |
Verdict |
|
P/E Ratio |
37.45 |
Bearish |
|
P/B Ratio |
11.92 |
Bearish |
|
PEG Ratio |
3.13 |
Bearish |
|
Current Ratio |
4.26 |
Bullish |
|
ROIC-WACC Ratio |
Positive |
Bullish |
The price-to-earnings (P/E) ratio of 37.45 indicates FAST is an expensive stock. By comparison, the P/E ratio for the S&P 500 is 30.27.
The average analyst price target for FAST is 43.46. It suggests modest upside potential with reasonable rising downside risks.
Fastenal Technical Analysis
Today’s FAST Signal
(Click on image to enlarge)
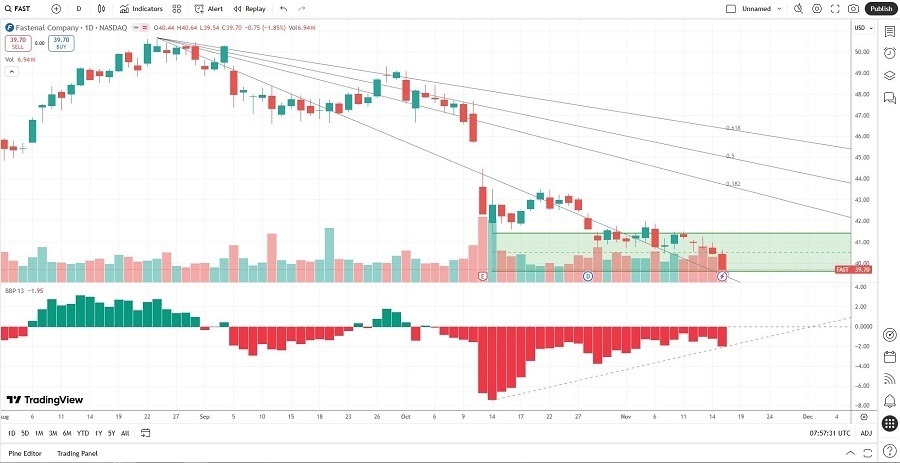
- The FAST D1 chart shows price action inside its horizontal support zone
- It also shows price action between its descending 0.0% and 38.2% Fibonacci Retracement Fan levels
- The Bull Bear Power Indicator is bearish with a positive divergence
- The average bearish trading volumes are higher than the average bullish trading volumes, a trend to monitor as price action approaches an inflection point
- FAST corrected faster than the S&P 500, but bullish factors are rising.
My Call
I am taking a long position in FAST between 39.05 and 40.64. While short-term risks remain and valuations are higher than I would like, Fastenal leads its industry in core operational metrics. Profit margins remained stable despite rising input costs, and I am bullish on its recently announced investment plans.
- FAST Entry Level: Between 39.05 and 40.64
- FAST Take Profit: Between 48.82 and 50.63
- FAST Stop Loss: Between 34.33 and 35.31
- Risk/Reward Ratio: 2.07
More By This Author:
The Best Nuclear Energy Stocks To Buy
The Best Gold Stocks To Buy Now
AUD/USD Forex Signal: Bullish On Improving Risk Sentiment


Comments
Log in or sign up to join the conversation.