

Exxon Mobil Corp. XOM shares are trading lower Wednesday as oil prices pull back following recent strength. Oil stocks have been gaining in recent weeks as a result of the Russia-Ukraine conflict and a resulting U.S. ban on Russian oil imports.
Exxon Mobil was down 5.88% at $82.62 ahead of the close.
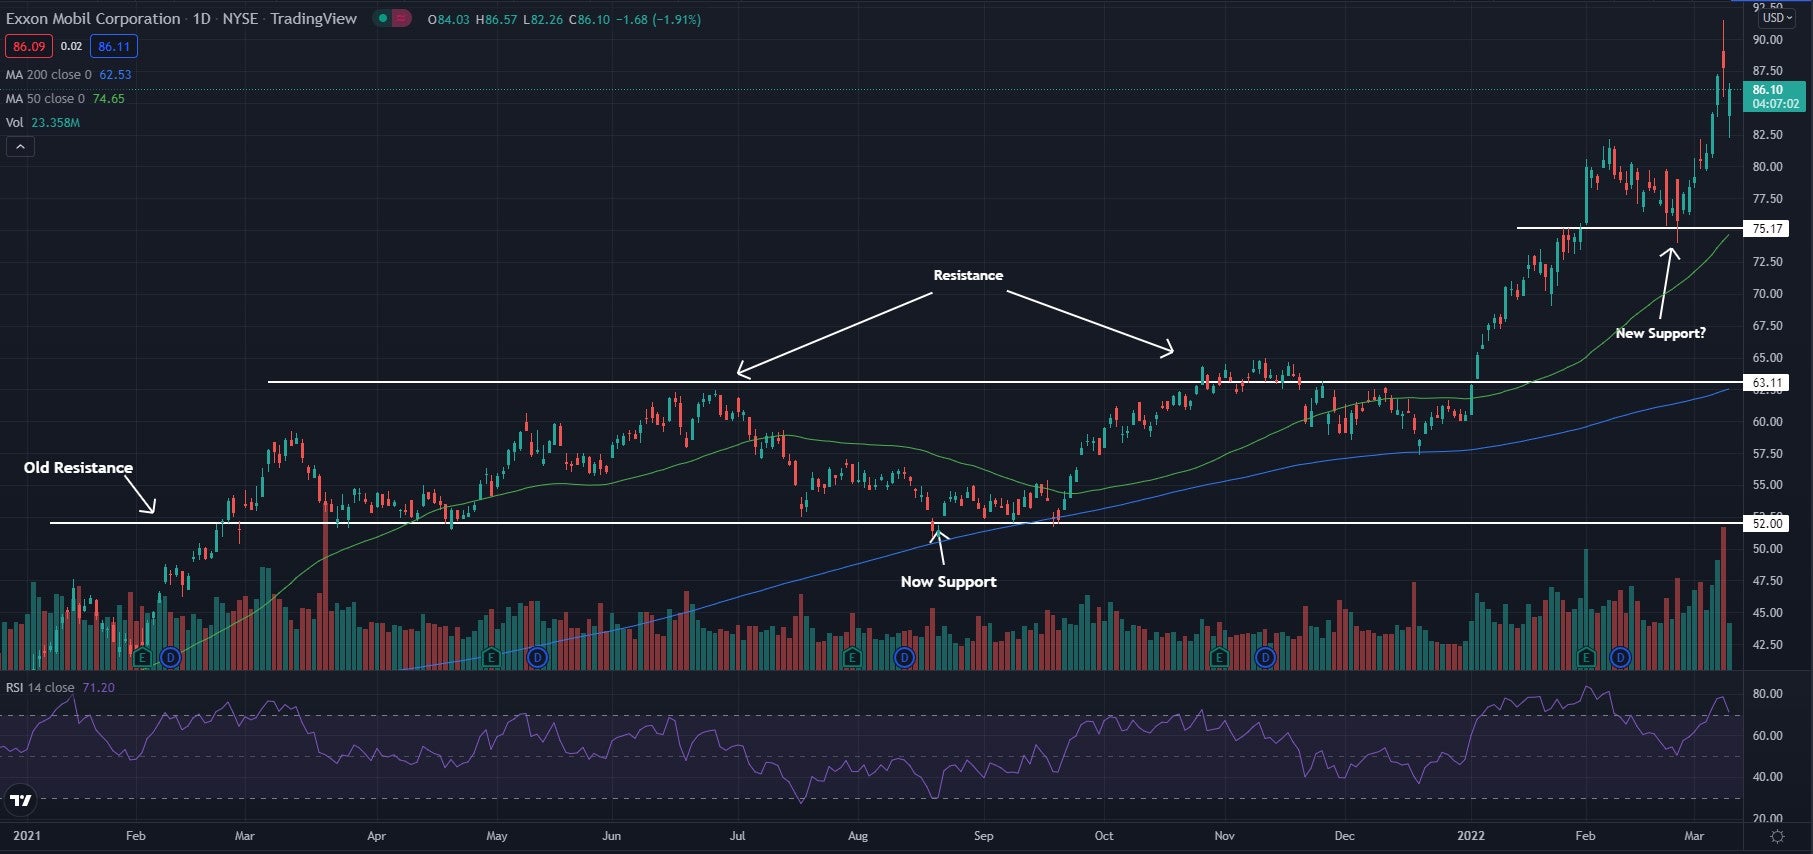
Exxon Mobil Daily Chart Analysis
The stock broke above the $63 resistance and has been flying since the break above. The stock looks to have found some support near the $75 level; this area may become support again in the future and could become a long-term area if it can hold as support multiple times.
The stock trades above both the 50-day moving average (green) and the 200-day moving average (blue). This indicates the sentiment is turning bullish, and each of these moving averages may hold as an area of support in the future.
The Relative Strength Index (RSI) has been pushing higher and now sits at 71. The RSI is in the overbought region and is showing the stock is seeing much more buying pressure than selling pressure. If the RSI can stay in this area, the stock may continue to push higher.
(Click on image to enlarge)
What’s Next For Exxon Mobil?
Exxon Mobil is seeing a strong period of bullish momentum as oil prices have pushed higher. This strong bullish push is likely going to see a period of consolidation for a time before the price pops again.
Bullish traders want to see the stock fall back to support before possibly entering. Bearish traders are looking for a break below the support to see a possible move down toward the next area of support near $63.


Comments
Log in or sign up to join the conversation.