Exxon Mobil Corp Found Sellers At The Blue Box Area
Hello fellow traders. In this technical article we’re going to take a quick look at the Elliott Wave charts of Exxon Mobil Stock (XOM) published in members area of the website. As our members know the stock has been showing incomplete sequences in the cycle from the April 12th peak. Recently XOM has given us the recovery that reached our selling zone. The stock found sellers right at the Blue Box area and made the decline toward new lows as expected. In the further text we are going to explain the Elliott Wave Forecast and trading strategy.
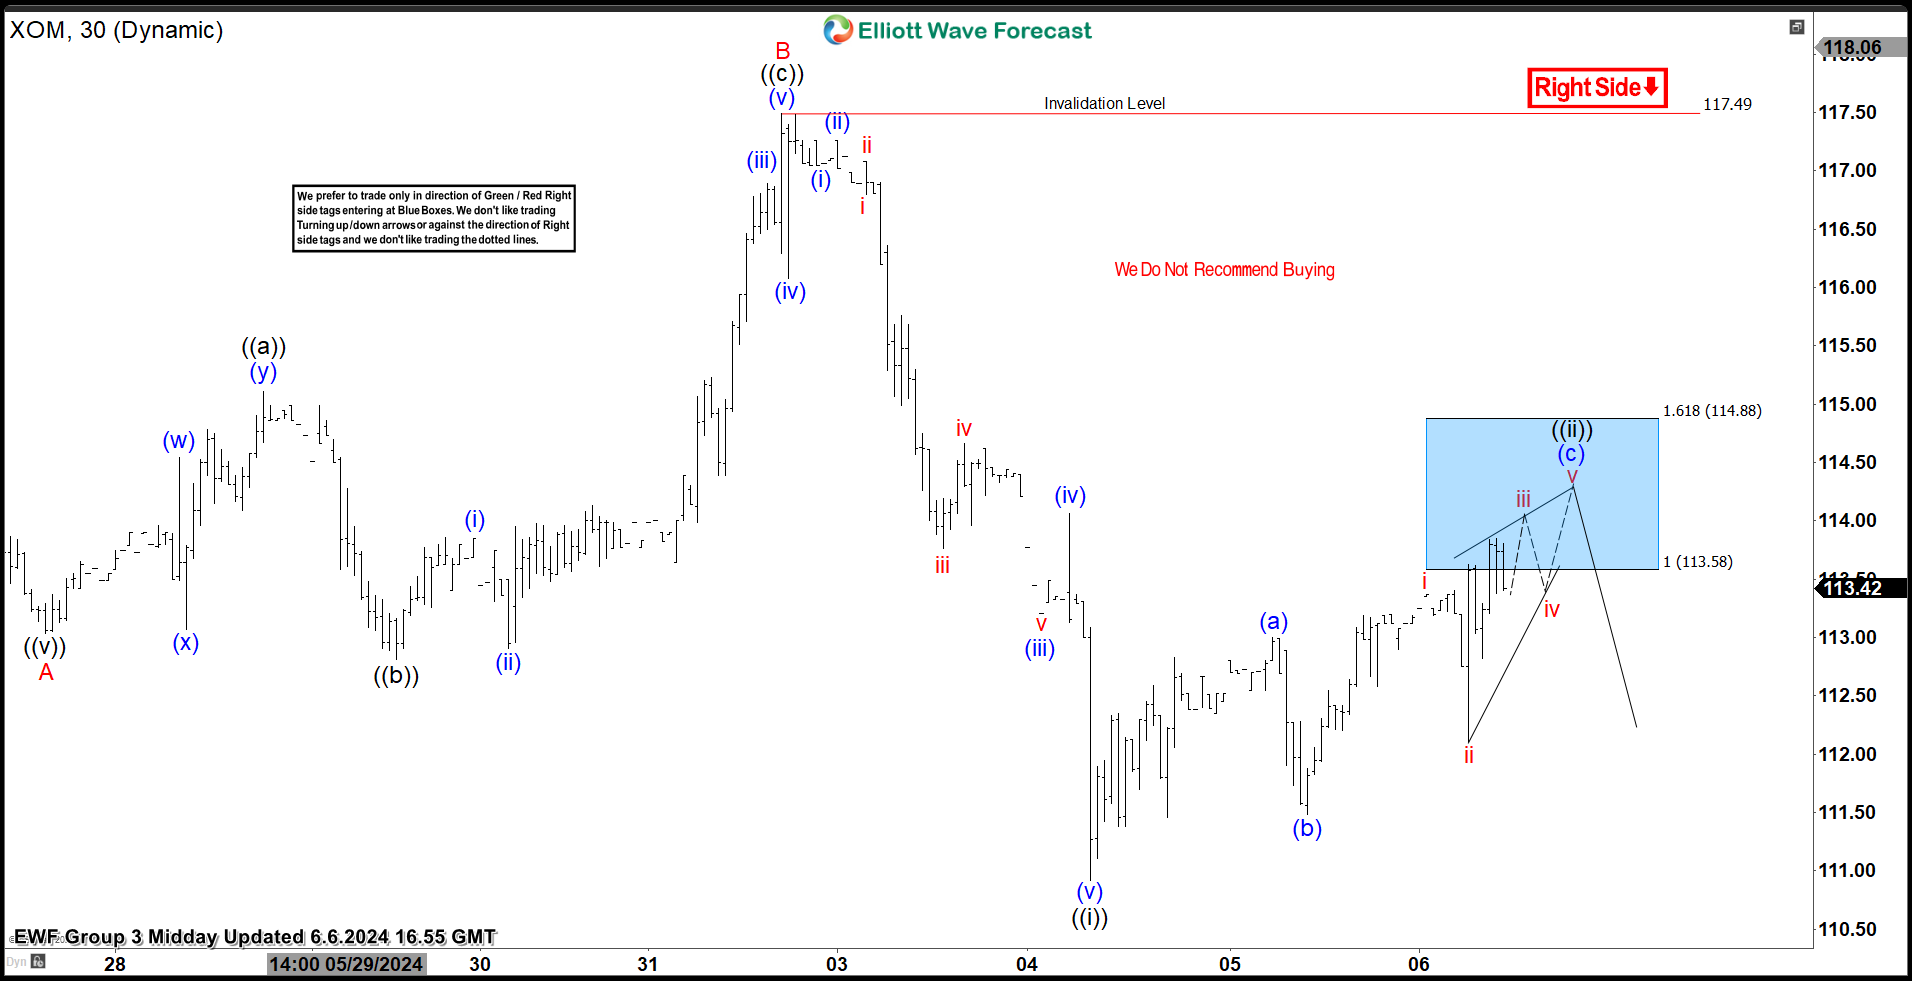
XOM Elliott Wave 1 Hour Chart 06.06.2024
The stock is correcting the cycle from the 117.49 peak , giving us ((ii)) black recovery. The price has already reached the extreme zone at 113.58-114.88 (Blue Box – sellers zone). As of right now, we expect more short term strength within Blue Box to complete proposed correction. We don’t recommend buying the stock and prefer the short side from the blue box zone. As the main trend is bearish, we expect to see at least 3 waves pullback from our selling zone. Once the decline reaches 50 Fibs against the (b) blue low, we will make the short position risk-free (put SL at BE) and take partial profits.
(Click on image to enlarge)
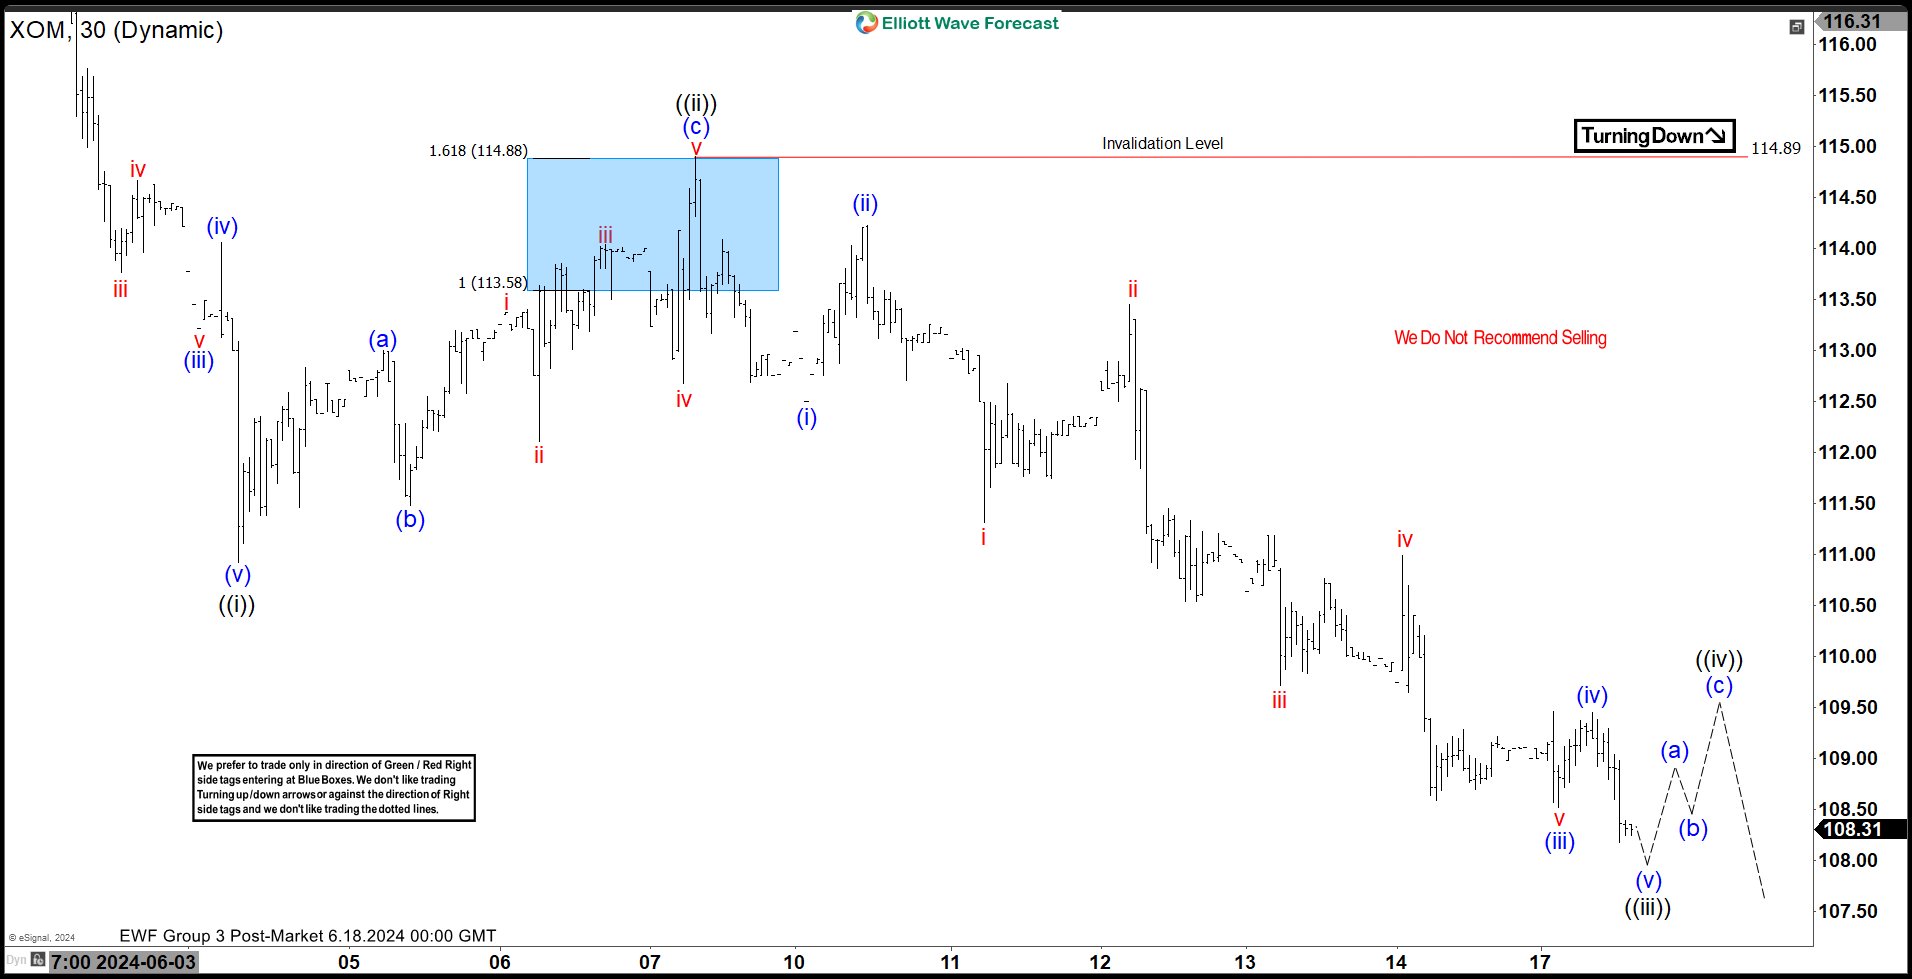
XOM Elliott Wave 1 Hour Chart 06. 18.2024
XOM found sellers at the Blue Box area: 113.58-114.88. We are receiving a good reaction from the selling zone. The decline made breaks toward new lows. So, members who took the short trade are currently enjoying profits in risk-free positions.
Keep in mind that market is dynamic and presented view could have changed in the mean time. You can check most recent charts in the membership area of the site. Best instruments to trade are those having incomplete bullish or bearish swings sequences. We put them in Sequence Report and best among them are shown in the Live Trading Room.
(Click on image to enlarge)
Elliott Wave Forecast
Thank you for exploring our Trading Setup of XOM with us. While we provide insights on 78 instruments, it’s important to note that not every chart is a trading recommendation. For our official trading recommendations, join us in our Live Trading Room where we provide actionable insights in real-time. If you’re not yet a member, take advantage of our 14-Day Trial now to access new trading opportunities.
Over time, we’ve honed a reputable trading strategy that accurately defines entry, stop loss, and take profit levels. By joining us, you’ll have the opportunity to learn from market experts and improve your trading skills.
More By This Author:
Elliott Wave Expects Nasdaq 100 To Continue HigherCROX Should Continue Further Upside
BAC Keeps Reacting Higher From The Blue Box Area
Disclaimer: Futures, options, and over the counter foreign exchange products may involve substantial risk and may not be suitable for all investors. Leverage can work against you as well as for ...
more


