
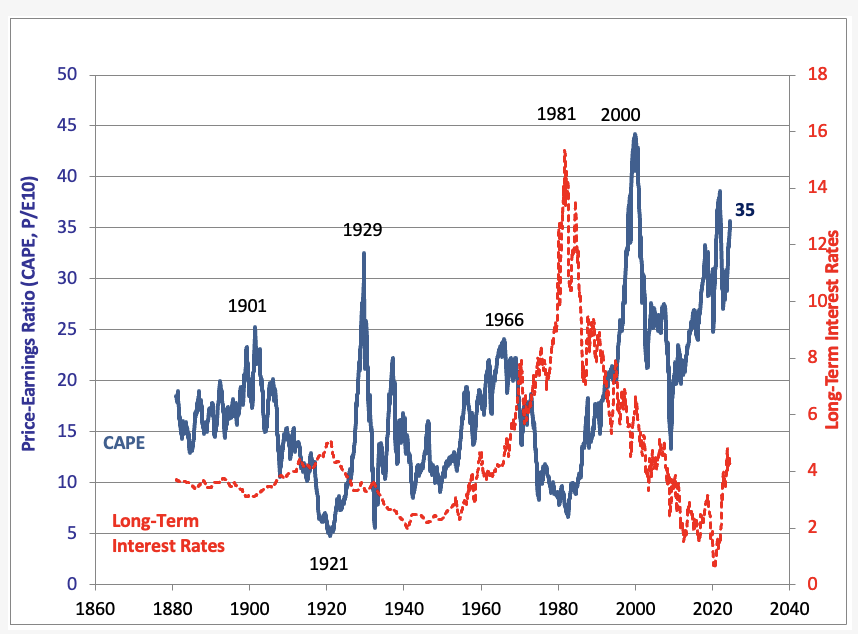
At 35x the average of the past decade’s earnings, adjusted for inflation, the S&P 500 basket of stocks is the third most expensive since 1871 (CAPE, in blue below, versus long-term interest rates in red, courtesy of Shillerdata.com). It is pricier than at the 1929 secular peak and more than twice the long-term median of 16x earnings.
The 12-month forward price-to-earnings ratio (PE) of 22.54x, compared with a long-term historical average of 16.5x, also suggests stocks are extremely expensive—just a little cheaper than in 2000 and late 2020. Nasdaq 100 and small-cap stocks (Russell 2000 index) are more expensive than the S&P 500, presently priced at 28.96 and 29.91x earnings, respectively.
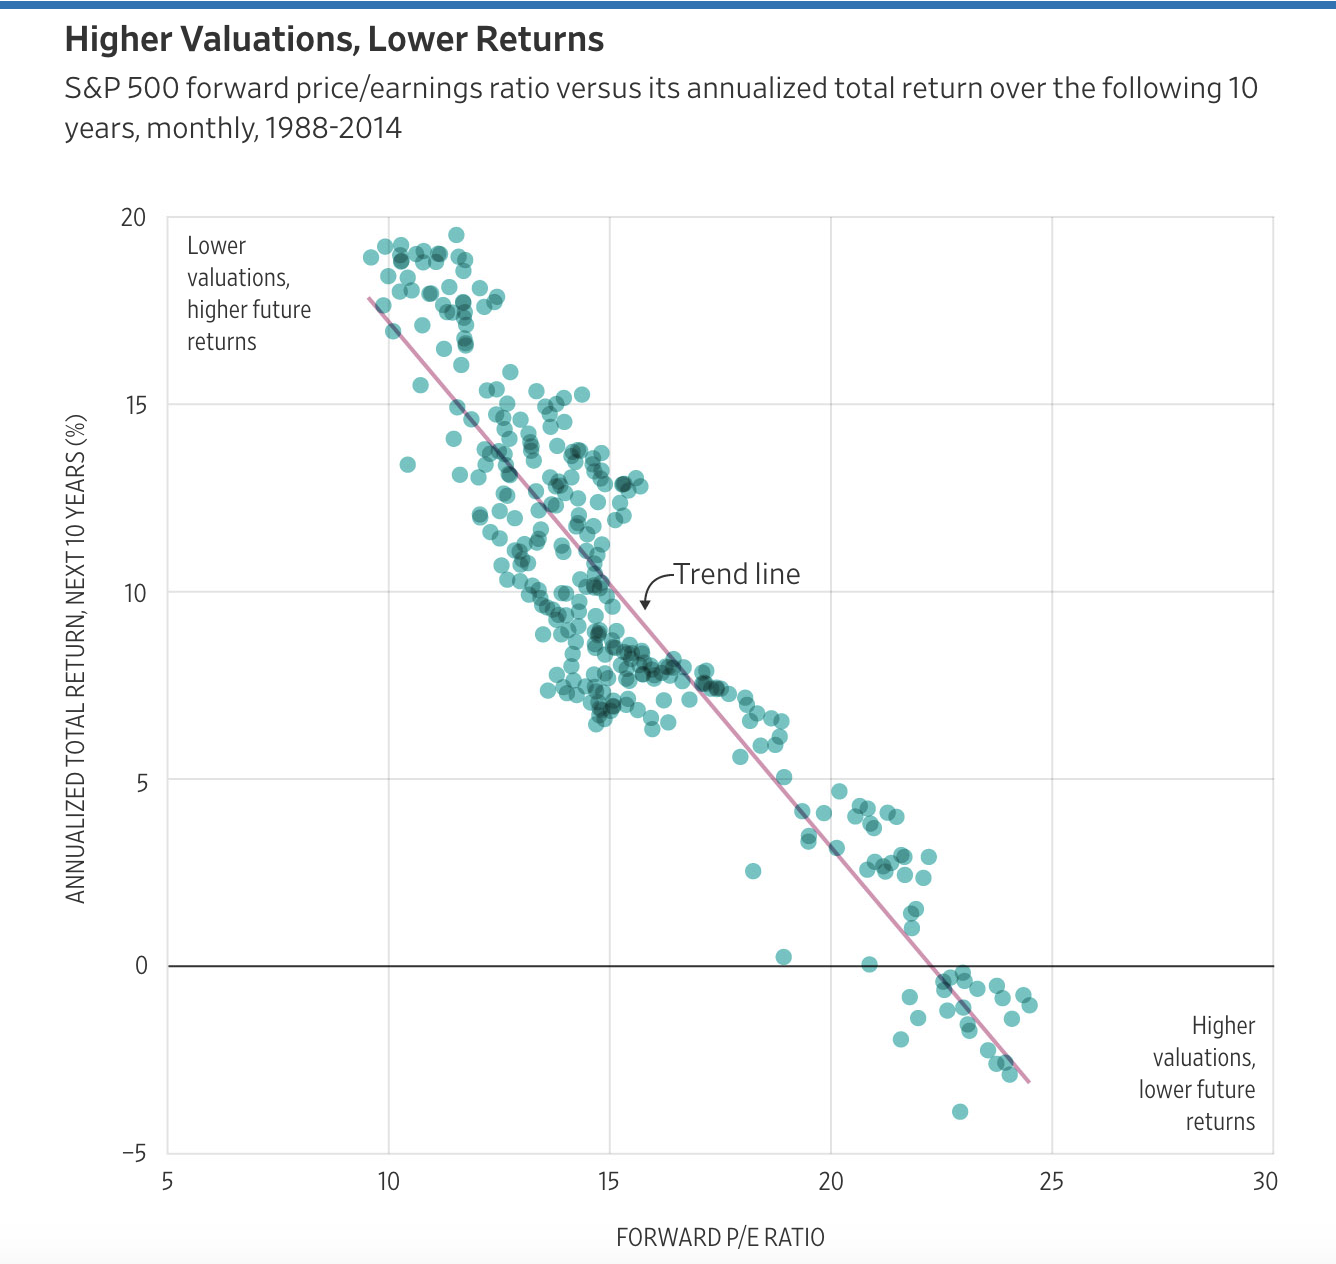
The chart below shows the S&P’s annualized total return over the following decade from the different forward PE levels since 1988. Here, we can see that ratios over 20x (x-axis) were consistently followed by a negative total return over the subsequent decade (y-axis). See, Markets are way out of line with reality, according to these measures.
To paraphrase Ben Graham, when valuations are rich, they offer no margin of safety, and no one should be surprised when investment returns are negative for years after that. It’s the math of mean reversion.
More By This Author:
Pandemic Era Wealth Mirage Has Evaporated For MostCanada’s Financial Hell Paved With Good Intentions
Inflated Prices Increasingly Weigh
Comments
Log in or sign up to join the conversation.