"Euphoria Is Increasing": Goldman Doubles Down On Market Meltup Call, Sees $90BN In New Stock Buying This Week
Last weekend we published a note by Goldman flow trader, Scott Rubner, who explained why despite a huge wall of worry which included such worries as a stagflation, China property bust, China slowing, Covid, tapering, corporate margin fears, snarled supply chains, energy, rate hikes, global growth slowing, higher rates, etc, stocks would melt up for a handful of simple reasons including a flood of buybacks and equity fund inflows, collectively amounting to roughly $8 billion per trading day, muted buyside sentiment, gamma flipping positive, a buying thrust from Vol Control funds and favorable seasonals.
In retrospect, and with the S&P hitting new all time highs just a few days later, the Goldman trader was spot on.
Fast forwarding one week, some may ask if Goldman's enthusiasm has tapered. The answer, as the flow trader wrote in his latest Tactical Fund Flow note, is not at all, and instead Rubner is doubling-down on optimism, once again predicting nothing but meltups for stocks in the weeks to come. If one had to summarize his sentiment with one word it would be FOMO - the money just keeps flowing into stocks as the mechanistic Pavlovian response to just keep buying because the Fed will never let stocks sink proves simply far too strong. As a result, the bank now expects a gargantuan $90 billion in global equity demand for the coming week (more below).
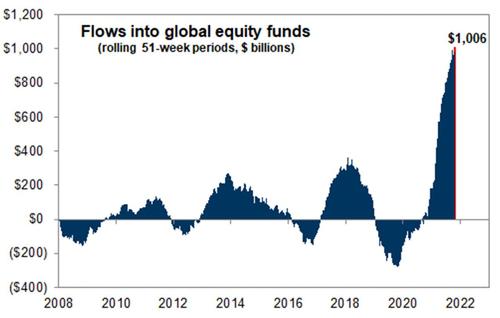
Global Equities logged >$1 Trillion dollars worth of inflows during the last 51 weeks and the start of positive vaccine news. This is the biggest market structure dynamic of the year. For context, the prior best rolling 51 week record was +$250 Billion. 2021 is 4x larger than the next best yearly inflow. I think the equity TINA money flow train keeps charging to close the year and accelerates aggressively in November. I calculate a significant, +$18B worth of non-fundamental equity demand every day this week and this increases with massive November monthly inflows and corporate demand after >47% of the S&P reports next week.
Below Rubner lays out his latest detailed take on why the most likely path for stocks is a continued meltup higher.
- 1. S&P 500 just logged its 55th new all-time high of 2021 after 7 straight gains and highest level since September 2nd. Watch CNBC “boo-ya Jim” headlines.
- 2. S&P 500 logged a new all-time high in every month so far this year and that has only happened one other time since 1928. (2014)
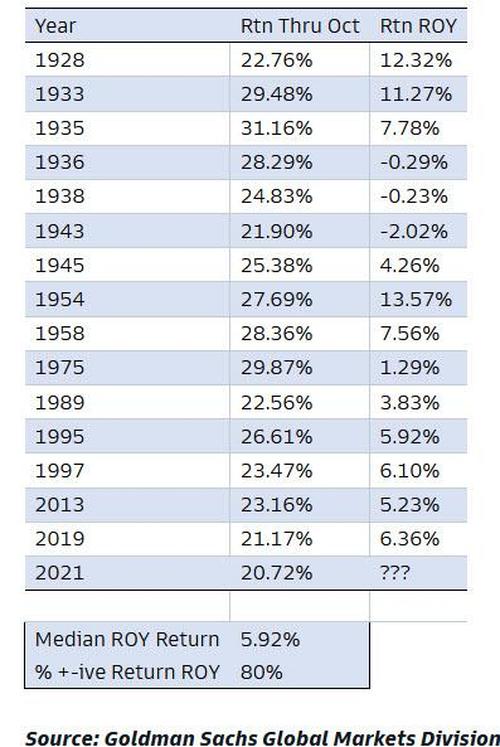
- 3. There have been 15 times since 1928, that the S&P is up >20% or more through October. The median return for the rest of the year (last two months only) is +5.92%, with an 80% hit rate. 2021 would be the 16th time.
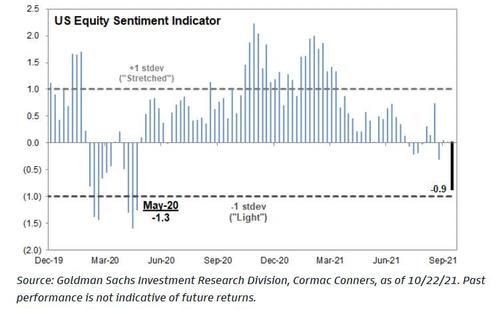
- 4. As of Friday, Goldman Sachs Sentiment Indicator, which pulls in 9 positioning indicators, logged the lowest reading (-.9), since May 22nd, 2020 (covid times), which was 73 weeks ago. (SPX was 2,955.45 vs. SPX 4,532.65 currently).
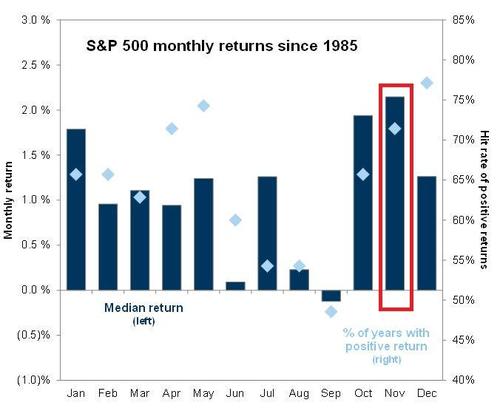
- 5. We are entering the strongest month (and best two month period) of the year with a median return of 2.1% and positive hit rate of 71% going back to 1985. VIX below 15, through pandemic lows.
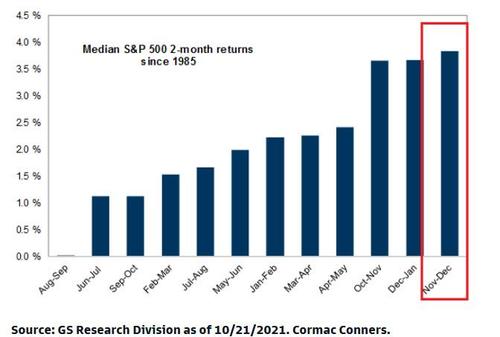
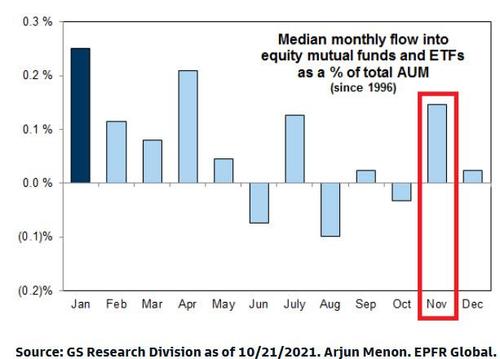
- 6. November Inflows is the biggest dynamic in the market next week. Goldman models +20bps of AUM ($23 Trillion) or +$46B of new demand (I expect double given money has completely halted going into bonds).
- 7. Improving tax headlines dampen my biggest flow-of-funds worry for December. I am reducing my probability of December selling, no selling of tech stocks is positive in itself.
- a) The timing of a potential capital gains tax rate hike has been a key focus of many investors. Long-term capital gains and qualified dividends are currently taxed at a maximum rate of 20%, along with a separate 3.8% tax on investment income. Vice President Biden has proposed taxing these as ordinary income for filers with over $1 million in annual income. This would roughly double the tax rate on capital gains and dividend income from 23.8% to 43.4%. Link
- b) Using Federal Reserve data, GS Research estimates the wealthiest households now hold around $1 trillion in unrealized equity capital gains. This equates to 3% of total US equity market cap and roughly 30% of average monthly S&P 500 trading volume.
- c) Past capital gains tax hikes have been associated with declines in equity prices and in total household equity allocations. In addition, high-momentum “winners” that had delivered the largest gains to investors ahead of the rate hike have usually underperformed. The Tech and Consumer Discretionary sectors have led the market this year and have also been the largest sources of capital gains within the US equity market during the last 3, 5, and 10 years.
- d) The wealthiest 1% were the biggest net sellers of equities across US households around the last capital gains rate hike in 2013. In the three months prior to the hike, the wealthiest households sold 1% of their starting equity assets, which would equate to around $100 billion of selling in current terms.
Just in case his euphoria outlook was not clear enough, Rubner then repeats what he wrote in various client chat rooms this week, explaining - again - he expects another epic liftathon.
- 1. CTA - GS systematic strats estimate $47B to buy over the next 1 week assuming a flat tape. (and $23B to buy in a down 2.5 standard deviation move lower). ~$10B of global equity demand per day.
- 2. Corporates - US Corporates are expected to purchase $3.80B shares per day. 47% of S&P reports next week.
- 3. Retail – This week Global equities logged +$25B worth of inflows or ~5B per day.
- 4. Retail (2) – US households currently own 38% of the $75 Trillion US Corporate Equity Market. There is a max frenzy around the new Bitcoin ETF launches. Pull up the DWAC SPAC, Euphoria is increasing.
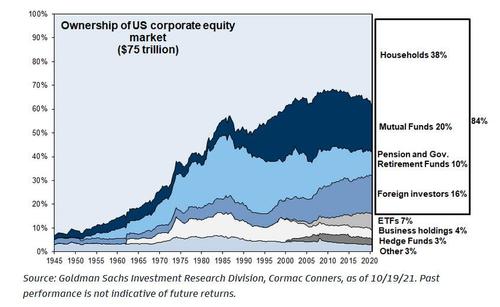
- 5. That is roughly $18B worth of global equity demand per day, every day this week, according to Goldman's calculations.
- 6. Positioning on the discretionary HF side remains low / negative / short, and Goldman is looking for any dip to be shallow.
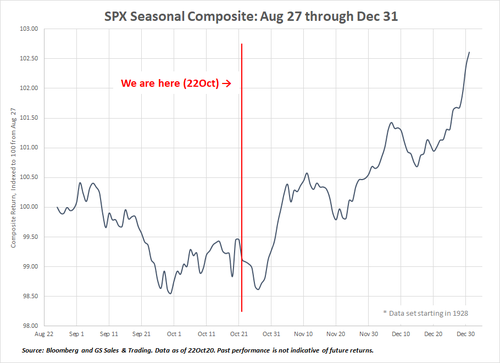
Last but not least, seasonals from here are up, up and away.
Disclosure: Copyright ©2009-2021 ZeroHedge.com/ABC Media, LTD; All Rights Reserved. Zero Hedge is intended for Mature Audiences. Familiarize yourself with our legal and use policies ...
more


I see the bad news as that comment towards the end of tghe third paragrph of this article, "The Federal Reserve would NEVER allow stocks to sink.....". I agree that it is true, and demonstrates more clearly than anything else that the Federal reserve bank does not have the well being of the general population as an agenda item. Clearly the fed supports "the One Percent" segment of the wealth holders.
I certainly DO NOT suport any level of socialism or wealth redistribution, but it is not reasonable to intentionally make the lower 99% of the population miserable. The fact should be recalled that there is such a thing as a breaking point, and when that point is passed things get really ugly, often in a real hurry with no control and nobody steering. This is certainly not a good scene, not at all what I hope for.
UNfortunately I do not have a quick and easy answer, nor does the fed, it appears. So it may get "rather interesting."
So… November tapering is NOT going to trigger massive correction?