Elliott Wave View: Nvidia Looking For A Double Correction

Image Source: Pexels
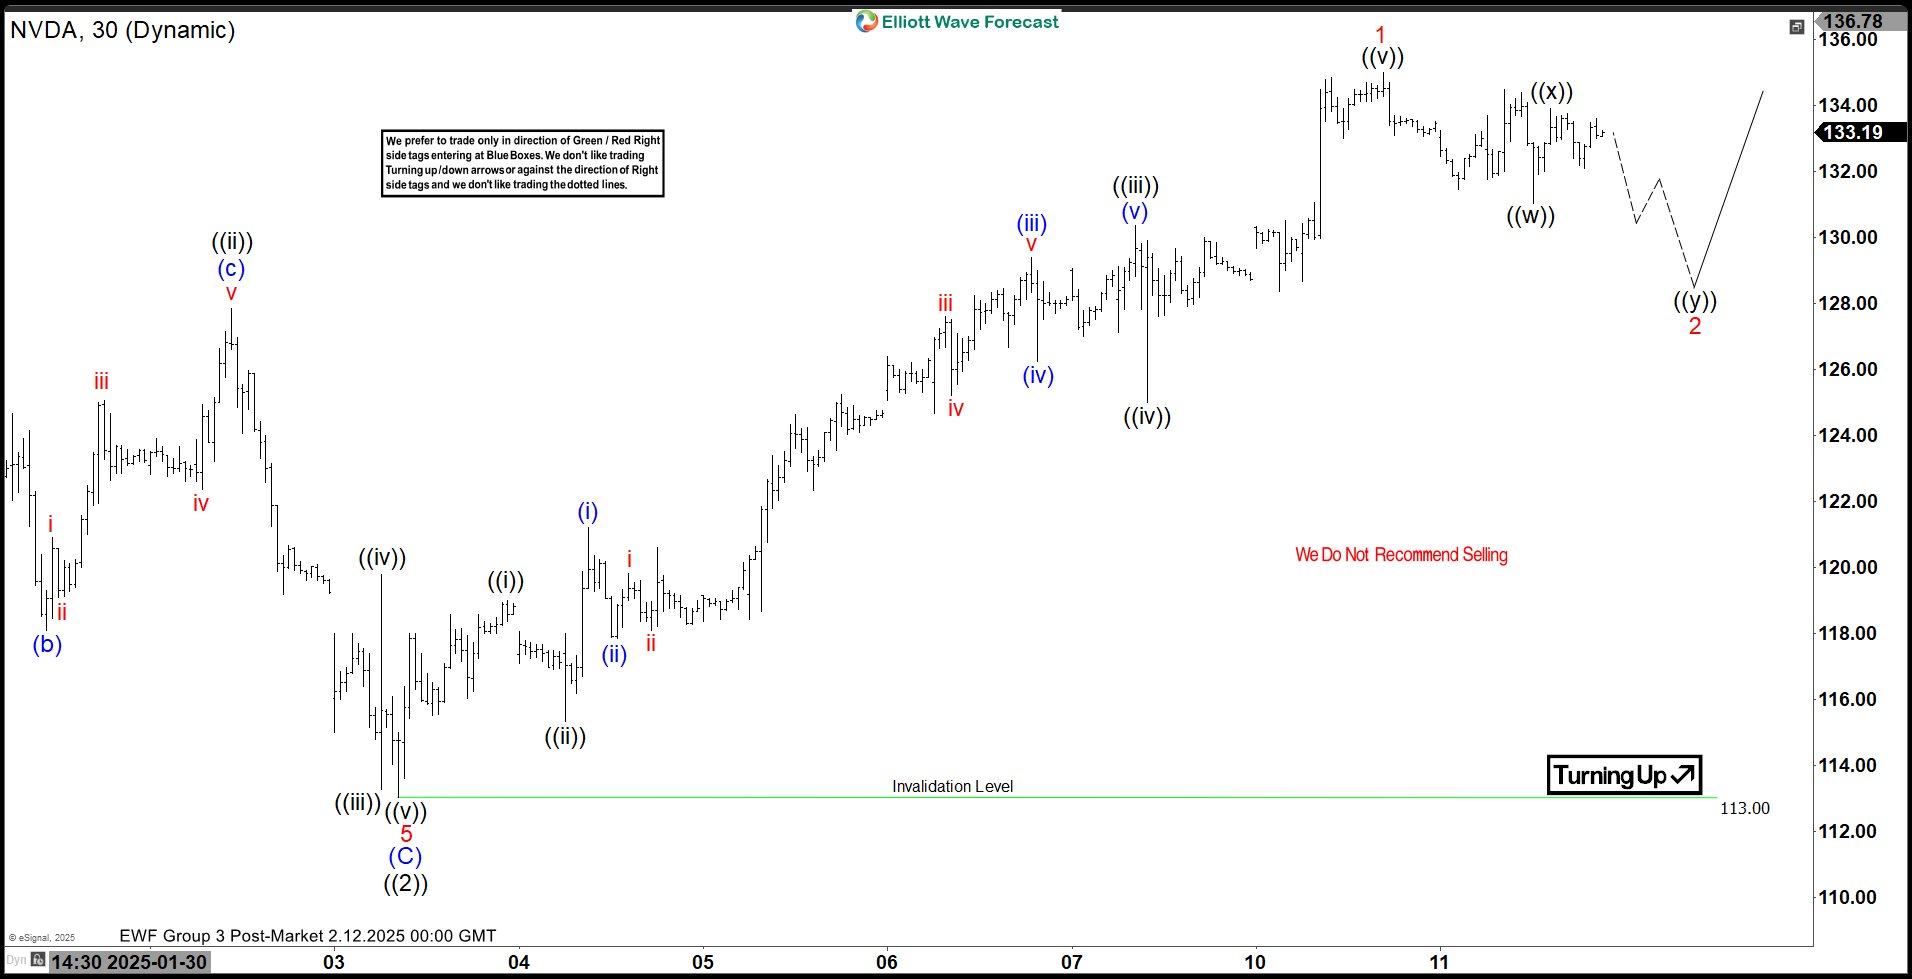
Short term Elliott Wave suggests the all-time high in Nvidia (NVDA) at 152.89 ended wave ((1)). Dips in wave ((2)) unfolded as an expanded Flat. Down from wave ((1)), wave (A) ended at 128.22 and wave (B) ended at 153.13. Down from there, wave 1 ended at 129.11 and wave 2 ended at 149.1. Wave 3 lower ended at 116.7 and wave 4 ended at 131.99. Wave 5 lower ended at 113 which completed wave (C) of ((2)) in higher degree. The 30 minutes chart below shows the pullback in wave ((2)).
The stock has turned higher in wave ((3)), but it still needs to break above wave ((1)) peak at 152.89 to rule out any double correction. Up from wave ((2)), wave ((i)) ended at 119 and pullback in wave ((ii)) ended at 115.33. The stock rallied higher in wave ((iii)) towards 130.37 and dips in wave ((iv)) ended at 125. Final leg wave ((v)) ended at 135 which completed wave 1. Wave 2 pullback is now in progress to correct cycle from 2.3.2025 low in 3, 7, or 11 swing before the next leg higher. Near term, as far as pivot at 113 low stays intact, expect pullback to find support in 3, 7, 11 swing for more upside.
Nvidia (NVDA) 30 Minutes Elliott Wave Chart
NVDA Video
Video Length: 00:05:08
More By This Author:
Dell Technologies Elliott Wave Analysis: Bullish Trend ResumesElliott Wave View: EURGBP Looking For Further Downside
XRP/USD Elliott Wave Analysis: Bullish Trend Remains Intact
Disclaimer: Futures, options, and over the counter foreign exchange products may involve substantial risk and may not be suitable for all investors. Leverage can work against you as well as for ...
more


