Elliott Wave View: FTSE Should See More Downside

Image Source: Pexels
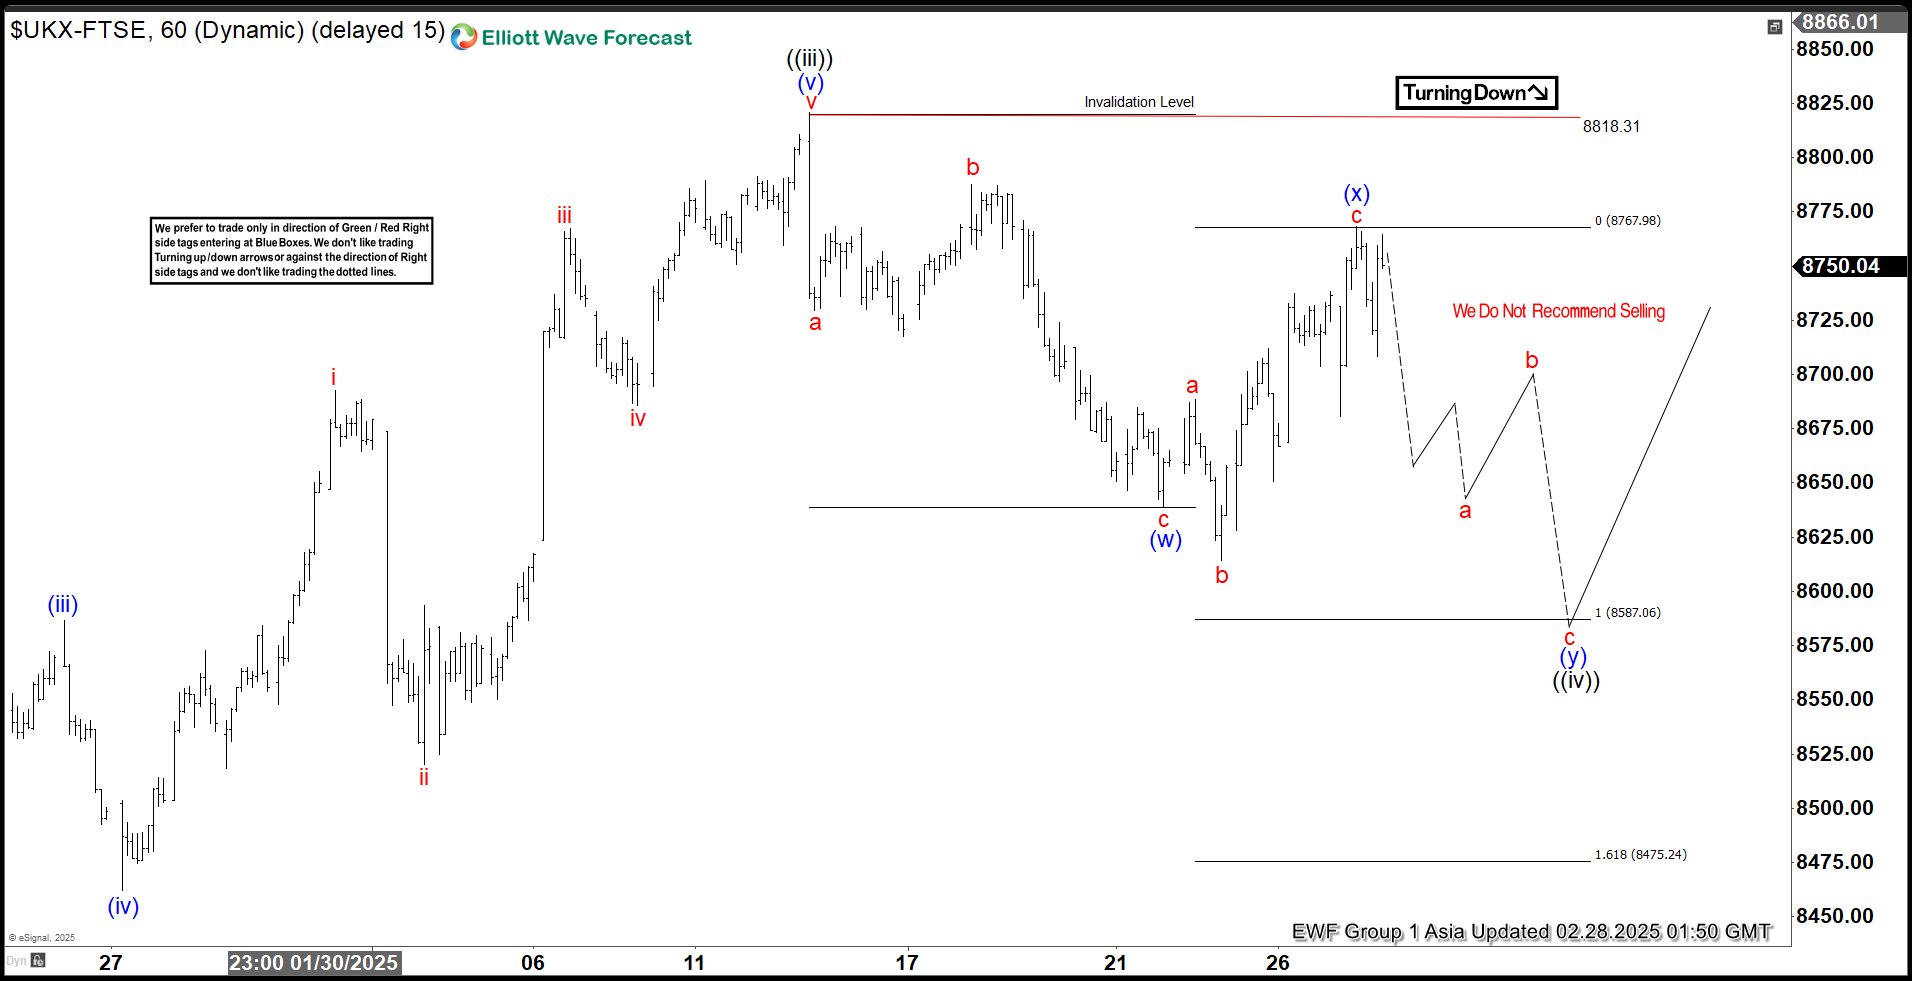
Short Term Elliott Wave View in FTSE suggests that cycle from 11.13.2024 low is in progress as a 5 waves impulse. Up from there, wave ((i)) ended at 8388.37 and pullback in wave ((ii)) ended at 8002.34. Wave ((iii)) higher subdivided into another 5 waves in lesser degree. Up from wave ((ii)), wave (i) ended at 8326.32 and pullback in wave (ii) ended at 8192.31. Wave (iii) higher ended at 8584.73 and dips in wave (iv) ended at 8462.18 as the 1 hour chart below shows.
The Index then resumed higher. Up from wave (iv), wave i ended at 8692.84 and wave ii pullback ended at 8520.2. Wave iii higher ended at 8767.5 and pullback in wave iv ended at 8685.78. Final leg wave v ended at 8820.93 which completed wave (v) of ((iii)). Pullback in wave ((iv)) is currently in progress as a double three Elliott Wave structure. Down from wave ((iii)), wave (w) ended at 8638.63 and wave ((x)) ended at 8768.05. Expect the Index to extend lower in wave (y) of ((iv)) to reach 8475 – 8587 area before it resumes higher. Near term, as far as pivot at 8818.31 high stays intact, expect rally to fail for further downside.
FTSE 60 Minutes Elliott Wave Chart
FTSE Video
Video Length: 00:04:42
More By This Author:
Elliott Wave View: Amazon Short Term May See Further UpsideDKNG Returned Higher After Completing The Pullback
Elliott Wave View: Bearish Sequence In Nifty Favors Downside
Disclaimer: Futures, options, and over the counter foreign exchange products may involve substantial risk and may not be suitable for all investors. Leverage can work against you as well as for ...
more


