Elliott Wave View: Bearish Sequence In Nifty Favors Downside

Image Source: Pexels
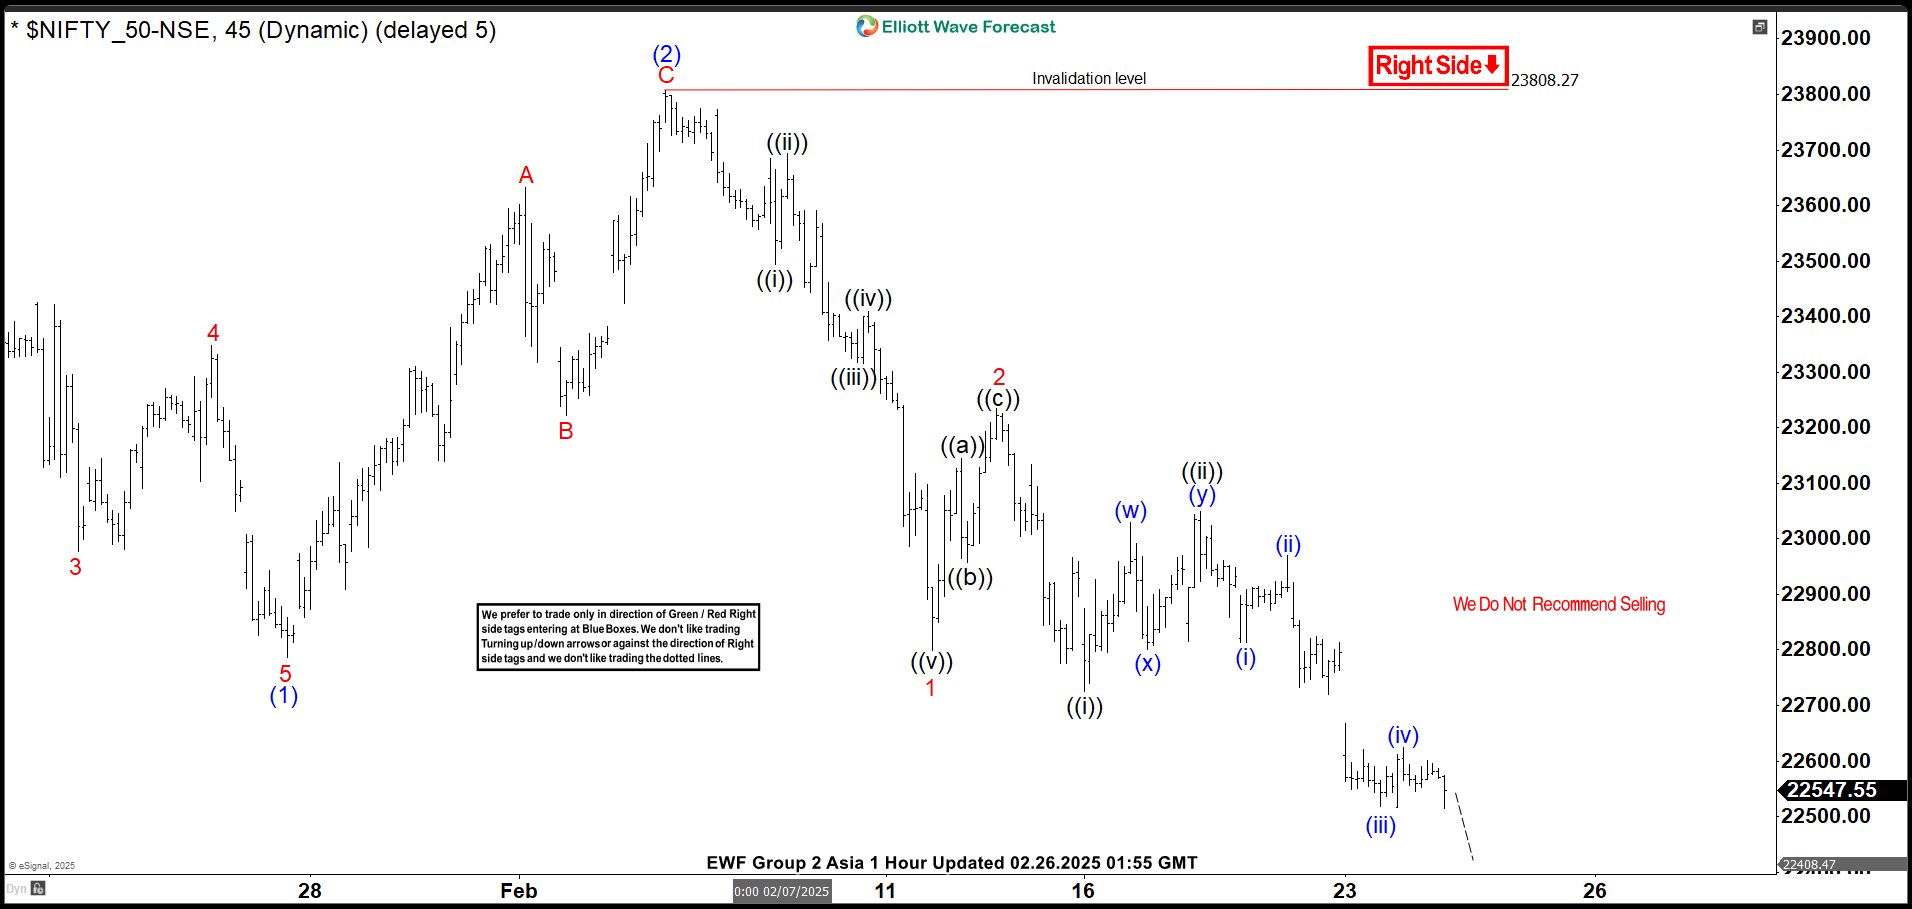
Short Term Elliott Wave View in Nifty shows an incomplete bearish sequence from 9.27.2024 high. Decline from there is unfolding as a zigzag Elliott Wave structure. Down from 9.27.2024 high, wave ((A)) ended at 23263.15 on 11.21.2024 low and wave ((B)) rally ended at 24857.75 on 12.5.2024 high. The extreme target lower for wave ((C)) is 100% – 161.8% Fibonacci extension of wave ((A)). This area comes at 19964 – 21842. Wave ((C)) is currently in progress with subdivision as an impulse Elliott Wave.
Down from wave ((B)), wave (1) ended at 22786.9 and wave (2) rally ended at 23807.3 with internal subdivision as a zigzag. Up from wave (1), wave A ended at 23632.45 and wave B ended at 23222. Wave C higher ended at 23808.27 which completed wave (2) in higher degree. The Index has resumed lower in wave (3). Down from wave (2), wave 1 ended at 22798.35 and wave 2 ended at 23235.5. The Index resumed lower in wave 3. Down from wave 2, wave ((i)) ended at 22725.45 and wave ((ii)) ended at 23049.95. Near term, while below 23808.27, expect rally to fail in 3, 7, or 11 swing for further downside.
NIFTY 45 Minutes Elliott Wave Chart
Nifty Video
Video Length: 00:05:39
More By This Author:
NextEra Energy Should Bounce Towards $75.77Elliott Wave View: Amazon In Support Zone
PepsiCo Finds Support In The Blue Box – Extended Rally Ahead?
Disclaimer: Futures, options, and over the counter foreign exchange products may involve substantial risk and may not be suitable for all investors. Leverage can work against you as well as for ...
more


