
Elliott Wave Technical Forecast Spotify Technology S.A.
Spotify Technology S.A. (SPOT) – Daily Chart
Technical Analysis Based on Elliott Wave Theory
FUNCTION: Trend
MODE: Impulsive
STRUCTURE: Motive
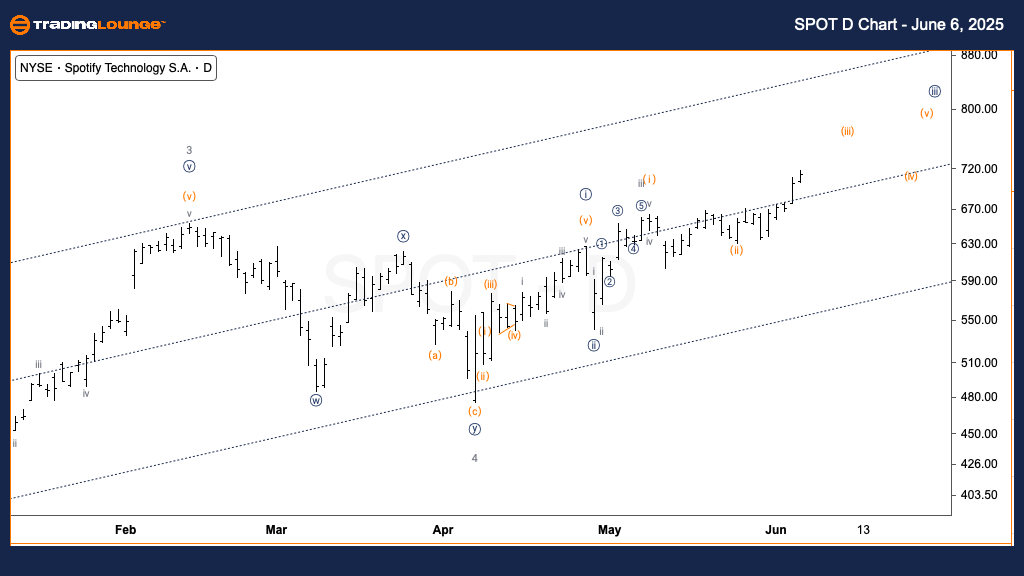
POSITION: Wave (iii) of {iii}
DIRECTION: Upside in wave (iii)
DETAILS: This represents the most bullish scenario for SPOT, forecasting potential movement toward the $800 level as wave (iii) extends.
Spotify is demonstrating a strong bullish structure on the daily chart, situated in wave (iii) of a larger wave {iii}. This formation suggests increasing momentum and strong upside potential, with $800 acting as the expected price target under this scenario. The chart supports the impulse structure, reinforcing upward continuation in the near term.
Spotify Technology S.A. (SPOT) – 1-Hour Chart
Technical Analysis Based on Elliott Wave Theory
FUNCTION: Trend
MODE: Impulsive
STRUCTURE: Motive
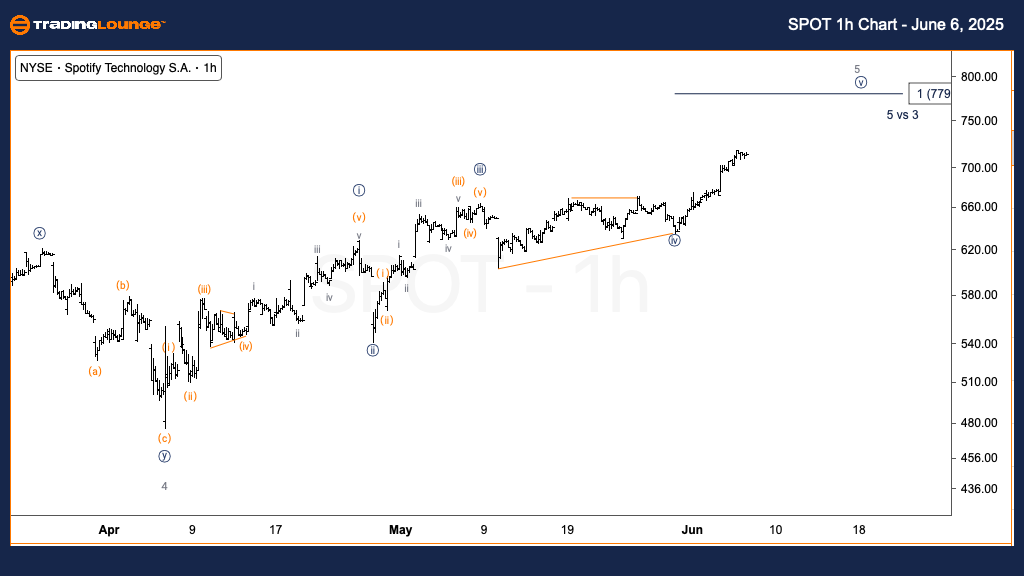
POSITION: Wave {v} of 5
DIRECTION: Upside in wave {v}
DETAILS: This more conservative outlook assumes wave {v} is now developing, with upside limited to $779, considering wave {iii} is shorter than wave {i}.
In the hourly timeframe, SPOT is moving within wave {v} of 5. With wave {iii} being shorter than wave {i}, upside is expected to cap at approximately $779, aligning with typical Elliott Wave guidelines. This count suggests a near-term high may soon form, followed by a likely corrective phase.
Technical Analyst: Alessio Barretta
More By This Author:
Elliott Wave Technical Forecast: Newmont Corporation - Friday, June 6
Elliott Wave Technical Analysis: Bovespa Index - Friday, June 6
Elliott Wave Technical Analysis: Australian Dollar/U.S. Dollar - Friday, June 6
At TradingLounge™, we provide actionable Elliott Wave analysis across over 200 markets. Access live chat rooms, advanced AI & algorithmic charting tools, and curated trade ...
more

