

Image Source: Unsplash
Zscaler Inc., Elliott Wave Technical Analysis
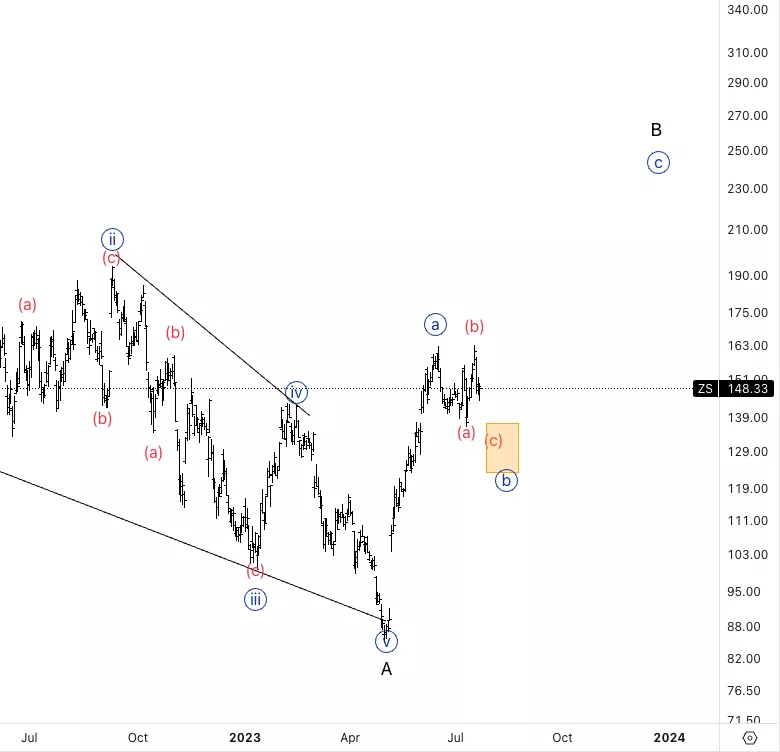
Zscaler Inc., (Nasdaq: ZS): Daily Chart, 25 July 2023.
ZS Stock Market Analysis: We have been looking for a pullback after what seemed to be a leading diagonal into wave A. Therefore, we are expecting a three wave pullback into wave B as we seem to have completed wave {a}.
ZS Elliott Wave Count: Wave {b} of B.
ZS Technical Indicators: Above all averages.
ZS Trading Strategy: Looking for upside into wave {c} as we seem to be near the completion of wave {b}.
Analyst: Alessio Barretta
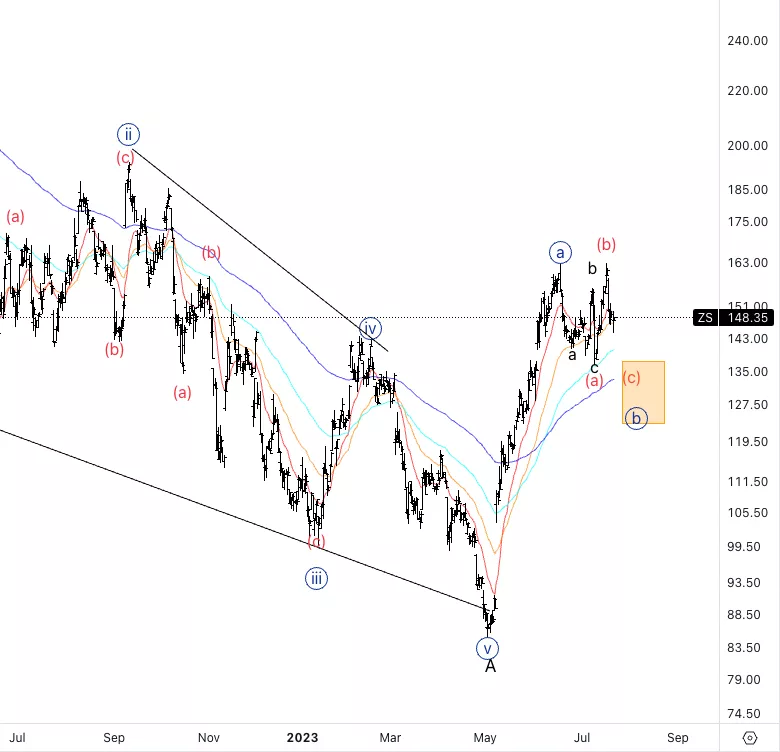
Zscaler Inc., ZS: 4-hour Chart, 25 July 2023.
Zscaler Inc., Elliott Wave Technical Analysis ZS Stock Market Analysis: Looking for another leg lower into wave (c) as the up move into wave (b) seemed to be corrective. Ideally we enter the box before resuming higher. We seem to be bouncing back and forth the 150$ which will eventually turn into support.
ZS Elliott Wave count: Wave (c) of {b}.
ZS Technical Indicators: Above 20EMA.
ZS Trading Strategy: Looking for additional downside into wave (c) to then resume higher.
More By This Author:
Elliott Wave Technical Analysis Day Chart: British Pound/Australian Dollar
Global Major Indices: Elliott Wave Analysis And Long Trades
Elliott Wave Technical Analysis Day Chart: U.S. Dollar/Japanese Yen


Comments
Log in or sign up to join the conversation.