

Photo by Chris Montgomery on Unsplash
Zoom Video Communications Inc., Elliott Wave Technical Analysis
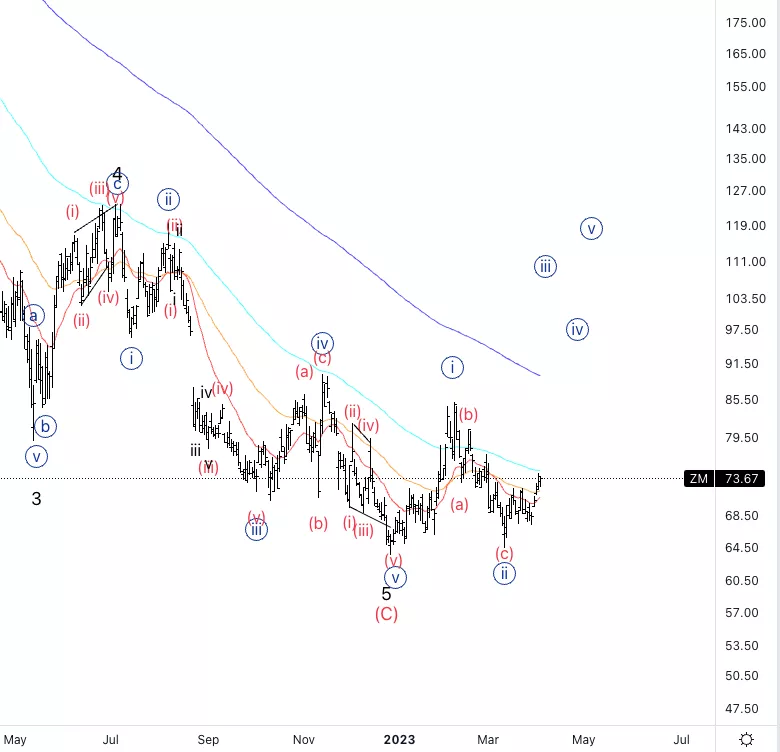
Zoom Video Communications Inc., (Nasdaq: ZM): Daily Chart, 4 April 2023.
ZM Stock Market Analysis: We are looking at a potential major bottom. If we go on the weekly timeframe we can see we have a strong RSI bullish divergence, which could indicate an up move is imminent.
ZM Elliott Wave Count: Wave {iii} of 1.
ZM Technical Indicators: Broke through the 20EMA.
ZM Trading Strategy: Looking for a clear five wave move to then look for upside.
Analyst: Alessio Barretta
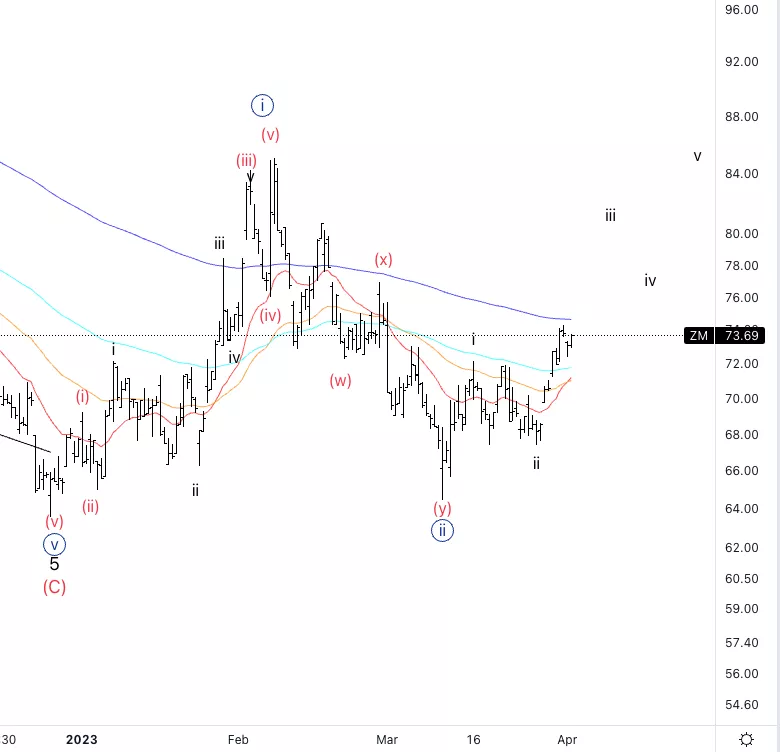
Zoom Video Communications Inc., ZM: 4-hour Chart, 4 April 2023.
Zoom Video Communications Inc., Elliott Wave Technical Analysis
ZM Stock Market Analysis: We can see five waves within wave i and then a clear three wave move into ii. Looking for longs off of the end of wave iv.
ZM Elliott Wave count: Wave iii of (i).
ZM Technical Indicators: Below 200EMA.
ZM Trading Strategy: Looking for a pullback in wave iv.
More By This Author:
Elliott Wave Technical Analysis: Dogecoin/U.S. Dollar, Tuesday, April 4
Elliott Wave Technical Analysis: Texas Instruments Inc. - Monday, April 3
Elliott Wave Technical Analysis: Polkadot/USD, Monday, April 3


Comments
Log in or sign up to join the conversation.