Elliott Wave Technical Analysis - Wheat
Wheat Elliott Wave Analysis
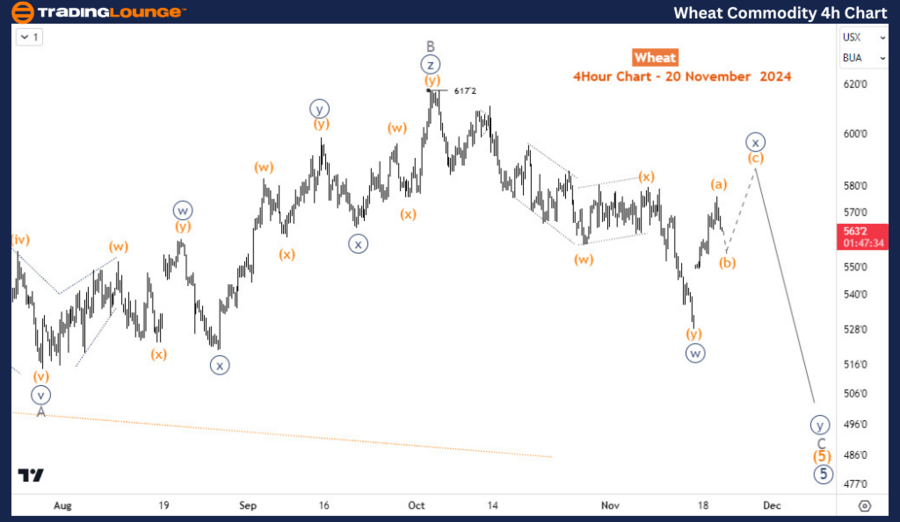
Wheat is returning to the lows of July 2024, where it last had a significant bounce against the bearish trend from March 2022. However, the recent decline from October may have an eye for the 26 July low as sellers’ control main gain momentum again, leading prices toward $500 and even below.
On the daily chart, the bearish run from March 2022’s high of 1364 is clearly in the last stage of an impulse wave structure. Meanwhile, the 5th wave is emerging into an ending diagonal structure which has been in its 5th wave since May 2024. Wave (5) of ((5)) is making a zigzag as usually seen in diagonal structures. However, it appears wave (5) is not yet finished.
On the H4 chart, Wave B of (5) ended at 617 (Oct 2024 high) and has been down for wave C of (5) which should extend below the July 2024 low where wave A finished. The current rally is the wave ((x)) of C which should finish below 617 if this idea will be valid. Further decline is expected to continue after wave ((x)), toward 500 or below as earlier mentioned.
Technical Analyst : Sanmi Adeagbo
More By This Author:
Elliott Wave Technical Analysis: U.S. Dollar / Japanese Yen Forex
Elliott Wave Technical Analysis: AAVE Token Crypto Price News For Wednesday, Nov 20
Unlocking ASX Trading Success: Rea Group Ltd - Tuesday, Nov. 19
Analyst Peter Mathers TradingLounge™ Australian Financial Services Licence - AFSL 317817

.thumb.png.2acac28104ec71ea6abbd146009268be.png)


