Elliott Wave Technical Analysis: The Boeing Company
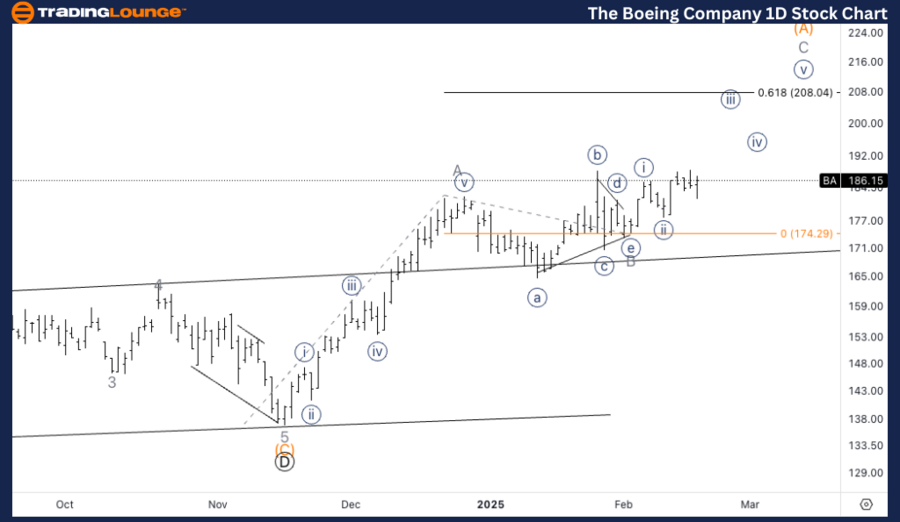
The Boeing Company (BA) - Elliott Wave Analysis (Daily & 1H Chart)
BA - Elliott Wave Technical Analysis (Daily Chart)
- Function: Counter Trend
- Mode: Corrective
- Structure: Flat
- Position: Wave E of 4
- Direction: Upside in Wave E
Details:
- The larger structure follows a three-wave subdivision within Wave E of a higher-degree Wave B triangle.
- Price remains contained within the triangle structure, but a breakout higher is expected in Wave E.
BA - Elliott Wave Technical Analysis (1H Chart)
- Function: Counter Trend
- Mode: Corrective
- Structure: Triangle
- Position: Wave C of (A)
- Direction: Upside into Wave C
Details:
- Anticipating upside acceleration into Wave (iii) as the market extends in Minute Wave {iii}.
- A 1.618 extension of Wave (iii) vs. (i) projects a target of $200.
Summary
This Elliott Wave analysis of The Boeing Company (BA) provides an overview of both the daily and 1-hour chart structures, outlining current trends and future price expectations.
- Daily Chart: BA is undergoing a flat correction within a larger triangle, currently positioned in Wave E of 4, with further upside expected.
- 1H Chart: The stock is moving through Wave C of (A), extending into Minute Wave {iii}, targeting $200 as the next resistance level.
Technical Analyst: Alessio Barretta
More By This Author:
Elliott Wave Technical Forecast: Rio Tinto Limited - Thursday, Feb. 20
Elliott Wave Technical Analysis: Euro/U.S. Dollar - Thursday, Feb. 20
Elliott Wave Technical Analysis: CAC 40 Index - Thursday, Feb. 20
At TradingLounge™, we provide actionable Elliott Wave analysis across over 200 markets. Access live chat rooms, advanced AI & algorithmic charting tools, and curated trade ...
more

.thumb.png.51d87732edc8397247ff27ce9489dc3d.png)


