Elliott Wave Technical Analysis - The Boeing Company
BA Elliott Wave Analysis Trading Lounge
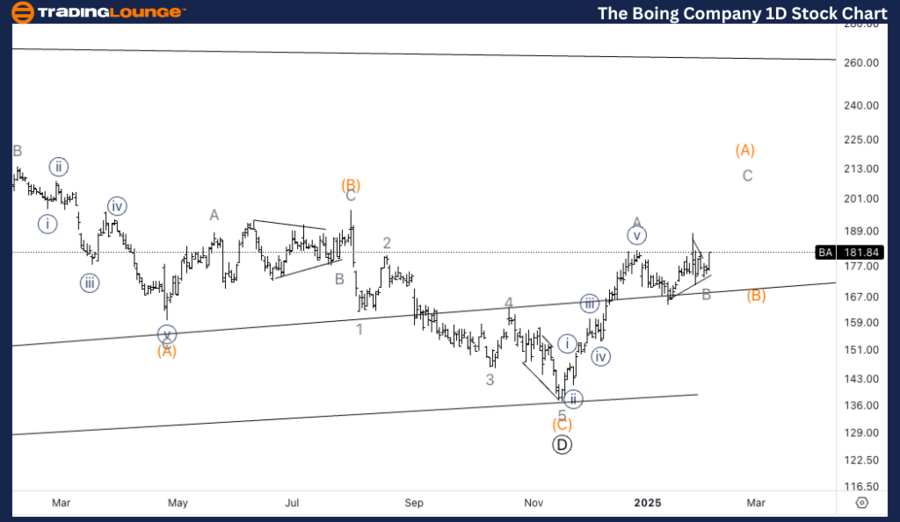
The Boeing Company, (BA) Daily Chart
BA Elliott Wave Technical Analysis
FUNCTION: Counter Trend
MODE: Corrective
STRUCTURE: Triangle
POSITION: Wave (A) of E
DIRECTION: Upside in wave C of (A).
DETAILS: We are looking for upside into wave C of (A), which could also turn out to be wave (C) of E instead, hence one degree higher. Looking for upside potentially towards Trading Level 2 t 200$ as upside target.
The Boeing Company, (BA) 1H Chart
BA Elliott Wave Technical Analysis
FUNCTION: Counter Trend
MODE: Corrective
STRUCTURE: Triangle
POSITION: Wave B of (A).
DIRECTION: Upside in wave C.
DETAILS: Looking for upside into wave C as we seem to have completed the triangle in wave B. Increasing volume on the bottom of B seems to be suggesting the low is in place. Looking for 200$ as minimum upside target.
This Elliott Wave analysis of The Boeing Company, (BA) outlines both the daily and 1-hour chart structures, highlighting the current trends and possible future price movements.
* BA Elliott Wave Technical Analysis – Daily Chart*
The Boeing Company (BA) appears to be in a corrective triangle pattern, currently unfolding in wave (A) of E. We expect upside momentum into wave C of (A), with a potential alternative scenario suggesting that this could be wave (C) of E, one degree higher. The key upside target lies near the TradingLevel2 at $200. Traders should watch for further strength as the stock approaches this target, as it could signal either the completion of wave (A) or indicate a more extended upward correction.
* BA Elliott Wave Technical Analysis – 1H Chart*
On the 1-hour chart, BA seems to have completed a triangle formation in wave B of (A), with the current wave C expected to push higher. Increasing volume at the bottom of wave B suggests that a low may already be in place. A continued breakout and rise toward the $200 target could confirm the completion of wave C, with further upside momentum likely. Monitoring key levels and volume will be important to confirm this corrective wave pattern.
Technical Analyst : Alessio Barretta
More By This Author:
Elliott Wave Technical Forecast: Aristocrat Leisure Limited
Elliott Wave Technical Analysis: U.S. Dollar/Japanese Yen - Thursday, Feb. 6
Elliott Wave Technical Analysis: AAVE Crypto Price News For Thursday, Feb 6
At TradingLounge™, we provide actionable Elliott Wave analysis across over 200 markets. Access live chat rooms, advanced AI & algorithmic charting tools, and curated trade ...
more

.thumb.png.fd3025e3507510611c9ee1154f2942ca.png)


