

Image Source: Unsplash
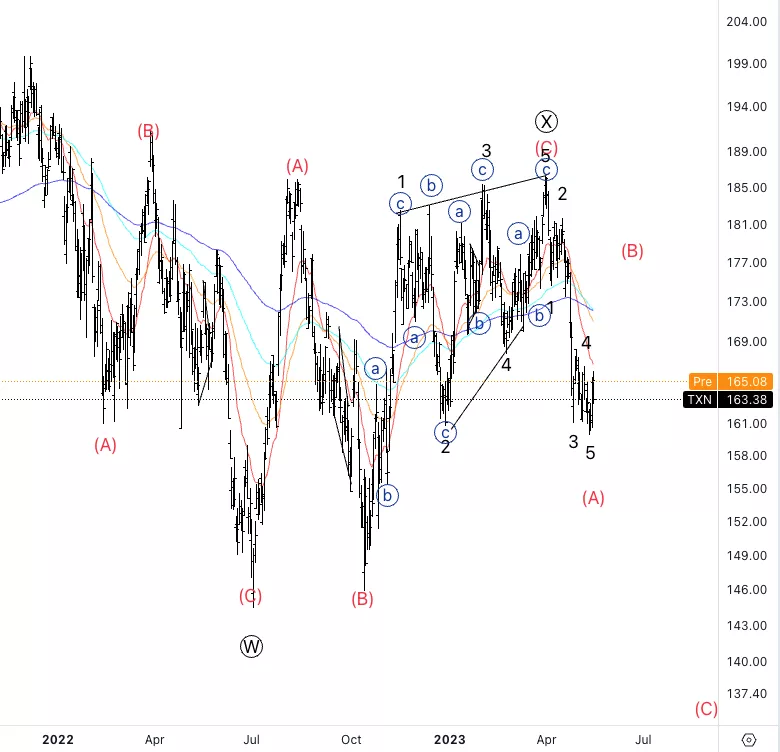
Texas Instruments Inc., Elliott Wave Technical Analysis
Texas Instruments Inc., (Nasdaq: TXN): Daily Chart, 17 May 2023.
TXN Stock Market Analysis: We have been looking for further upside into wave (v) as we seem to be in a leading diagonal into wave {i}. We just broke the previous wave (iii) top which has confirmed the count and we could now see an imminent sharp down move to start wave {ii}.
TXN Elliott Wave Count: Wave (v) of {i}.
TXN Technical Indicators: Above all averages.
TXN Trading Strategy: Looking for longs into wave (v) if there is evidence of upside left, if not it’s safer to wait for wave {ii}.
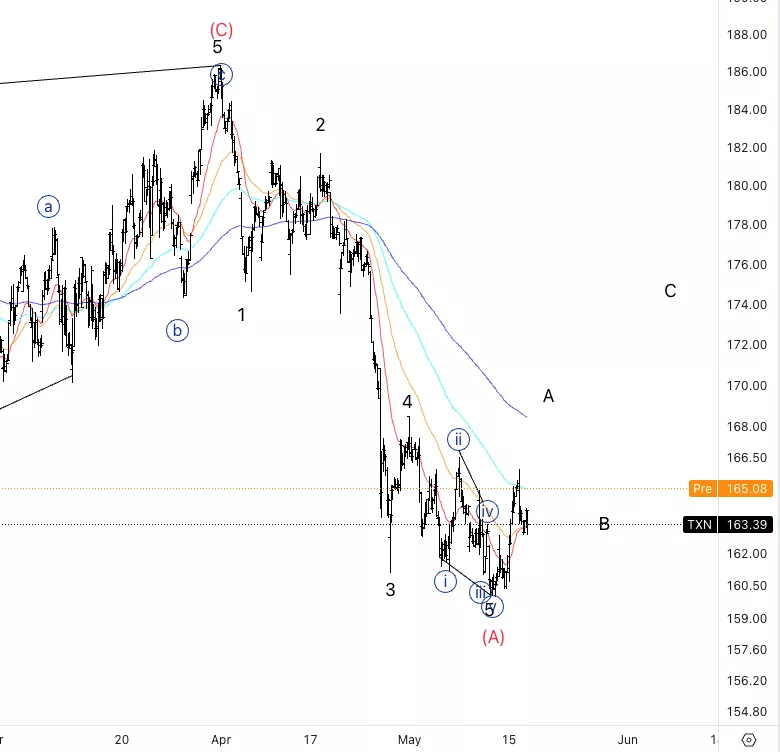
Analyst: Alessio Barretta
Texas Instruments Inc., TXN: 4-hour Chart, 15 May 2023.
Texas Instruments Inc., Elliott Wave Technical Analysis
TXN Stock Market Analysis: It looks like we are nesting higher into wave iii to then reach upside potential. A break north of 668$ could invalidate the count as wave (v) cannot be longer than (iii) in a leading diagonal.
TXN Elliott Wave count: Wave iii of (v).
TXN Technical Indicators: Above all averages.
TXN Trading Strategy: Looking for three wave pullback to then look for a continuation higher.
More By This Author:
Elliott Wave Technical Analysis: Ripple, Tuesday, May 17
Elliott Wave Technical Analysis: Lam Research Corp. - Tuesday, May 16
Elliott Wave Technical Analysis: NEO/U.S. Dollar - Tuesday, May 16


Comments
Log in or sign up to join the conversation.