Elliott Wave Technical Analysis: Texas Instruments Inc. - Tuesday, June 27
Image Source: Unsplash
Texas Instruments Inc., Elliott Wave Technical Analysis
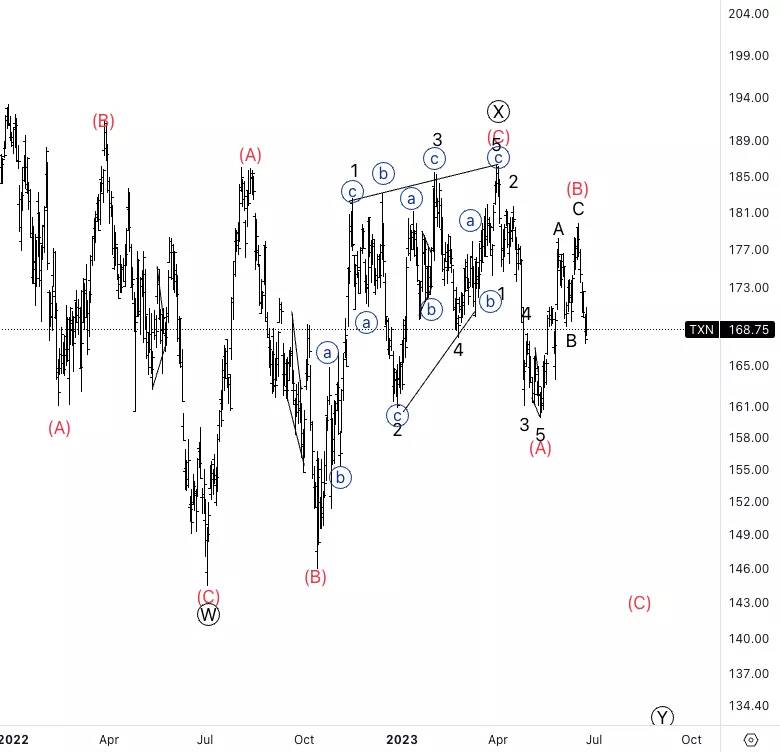
Texas Instruments Inc., (Nasdaq: TXN): Daily Chart, 27 June 2023.
TXN Stock Market Analysis: We have been looking at a significantly large correction in wave II as we have been correcting for almost two years. Looking for further downside into wave (C) as wave (B) seems to be completed.
TXN Elliott Wave Count: Wave (C) of Y.
TXN Technical Indicators: Below all averages.
TXN Trading Strategy: Looking for downside with invalidation level above wave X.
Analyst: Alessio Barretta

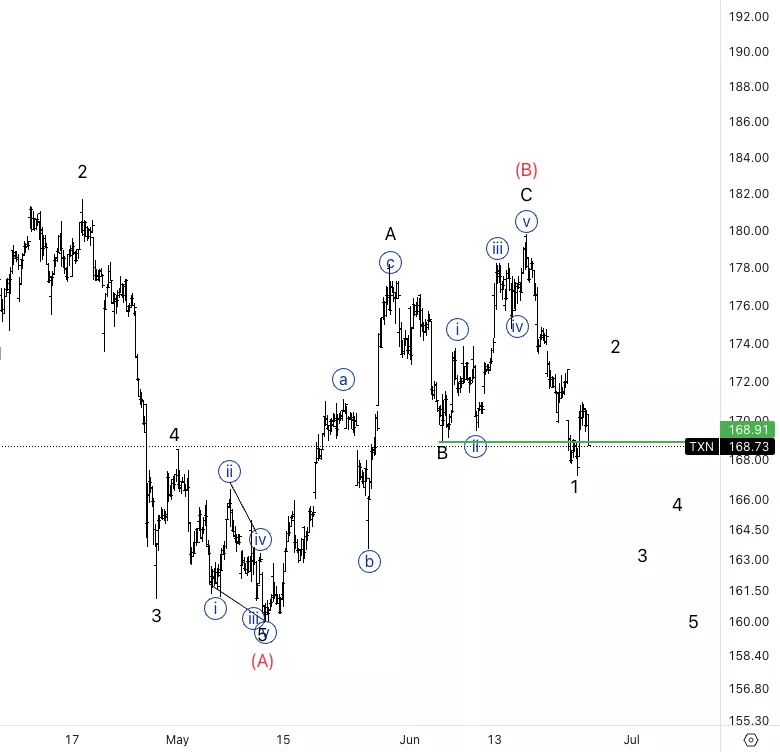
Texas Instruments Inc., TXN: 1-hour Chart, 27 June 2023.
Texas Instruments Inc., Elliott Wave Technical Analysis
TXN Stock Market Analysis: Looking for downside as we have broken wave B which broke the bullish corrective structure. Looking for a larger pullback in wave 2, as we could be in wave {a} of 2 to then look for more downside.
TXN Elliott Wave count: Wave 2 of (C).
TXN Technical Indicators: Below all averages.
TXN Trading Strategy: Looking for a deeper correction to then look for shorts.

More By This Author:
Commodity Market - Elliott Wave Technical Analysis
Elliott Wave Technical Analysis: Sea Ltd.
Uniswap / USD Elliott Wave Technical Analysis
Analyst Peter Mathers TradingLounge™ Australian Financial Services Licence - AFSL 317817


