
TSLA Elliott Wave Analysis Trading Lounge
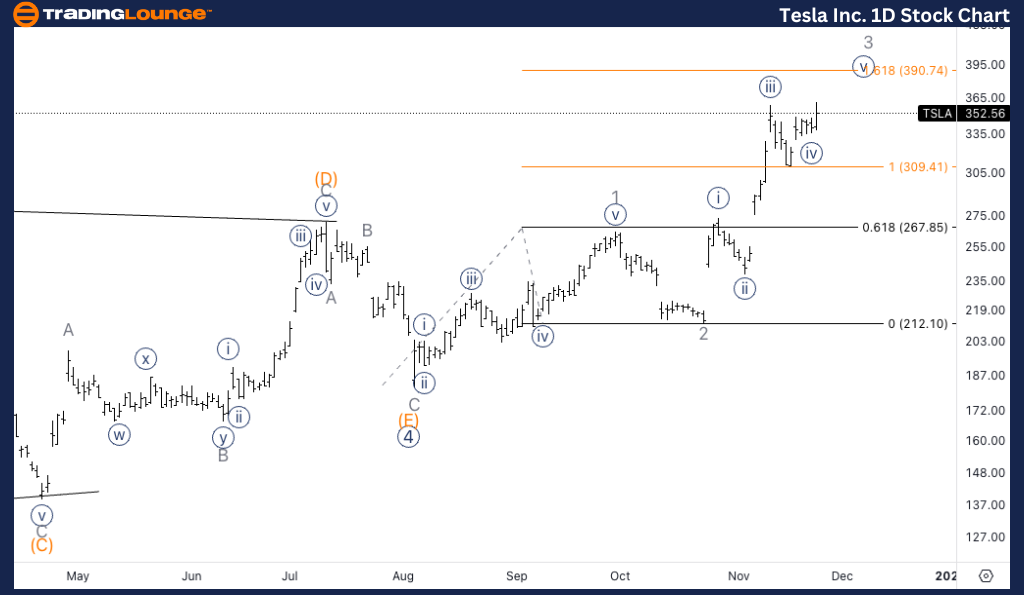
Tesla Inc., (TSLA) Daily Chart
TSLA Elliott Wave Technical Analysis
FUNCTION: Trend
MODE: Impulsive
STRUCTURE: Motive
POSITION: Minor wave 3.
DIRECTION: Upside in 3 of (1).
DETAILS: Looking for upside thrust after the completion of the long lasting triangle in primary wave 4. Looking for upside towards Medium level at 400$.
Tesla Inc., (TSLA) 1H Chart
TSLA Elliott Wave Technical Analysis
FUNCTION: Trend
MODE: Impulsive
STRUCTURE: Motive
POSITION: Wave {v} of 3.
DIRECTION: upside in wave {v}.
DETAILS: We have found support on top of the parallel channel and we are looking for 0.618 {v} vs. {i} at exactly where 1.618 3 vs. 1 stands at 390$, and equality of {v} vs. {i} at 433.
.png.e8f1fb643bbf4ce7e21bdd234190c833.png)
This Elliott Wave analysis for Tesla Inc., (TSLA) examines both the daily and 1-hour charts to assess its current market trend, utilizing Elliott Wave Theory to anticipate potential future movements.
* TSLA Elliott Wave Technical Analysis – Daily Chart*
Tesla (TSLA) is in the midst of Minor wave 3 within the larger Primary wave 5 following the completion of a long-lasting triangle in Primary wave 4. The analysis suggests a continuation of the upside thrust, with the price aiming for the Medium Level at $400. This move represents the third wave in a motive structure, often characterized by strong momentum and sharp gains. The daily outlook remains bullish with expectations of further gains as this wave develops.
* TSLA Elliott Wave Technical Analysis – 1H Chart*
On the 1-hour chart, Tesla has found support at the top of the parallel channel, indicating the potential for further upside in wave {v} of 3. Specific targets are being identified, with 0.618 of {v} vs. {i} aligning with 1.618 of wave 3 vs. 1, both converging at the $390 level. Should the wave extend, equality of {v} vs. {i} stands at $433, providing another key resistance level for traders to monitor.
Technical Analyst : Alessio Barretta
More By This Author:
Unlocking ASX Trading Success: Woodside Energy Group Ltd
Elliott Wave Technical Analysis - Polkadot Crypto Price News Today
SP500, Nasdaq 100 & Large Tech Stocks : Elliott Wave Strategies


Comments
Log in or sign up to join the conversation.