
Robinhood Markets Inc., Elliott Wave Technical Analysis

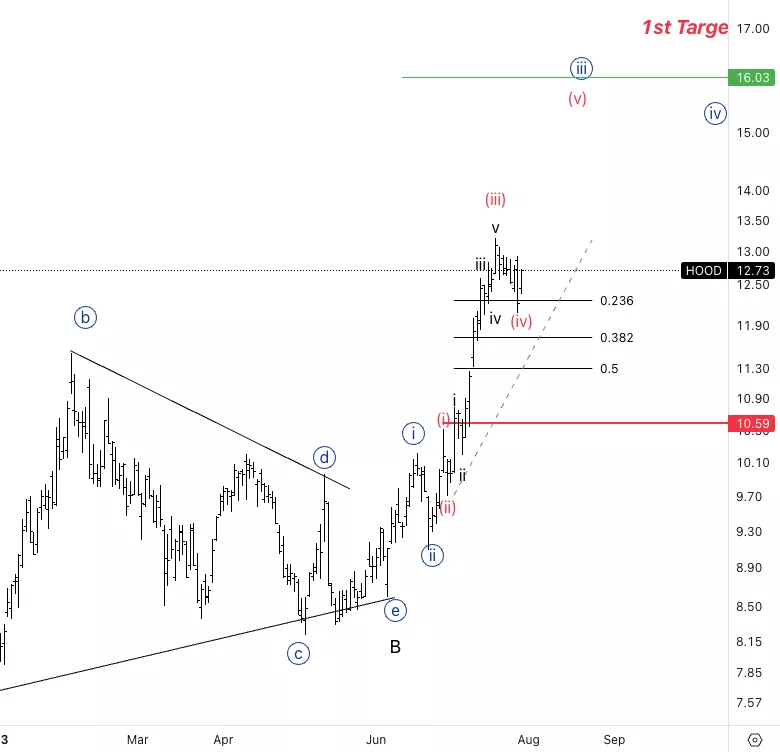
Robinhood Markets Inc., (HOOD): Daily Chart, Monday, July 31
HOOD Stock Market Analysis: We are looking for an extension higher into wave {iii} within a wave C of higher degree which target stands at 16$. Looking for additional upside as longs as the pullbacks look corrective in nature.
HOOD Elliott Wave Count: Wave (v) of {iii}.
HOOD Technical Indicators: Above all averages.
HOOD Trading Strategy: Looking for continuation higher into wave (v).
TradingLounge Analyst: Alessio Barretta
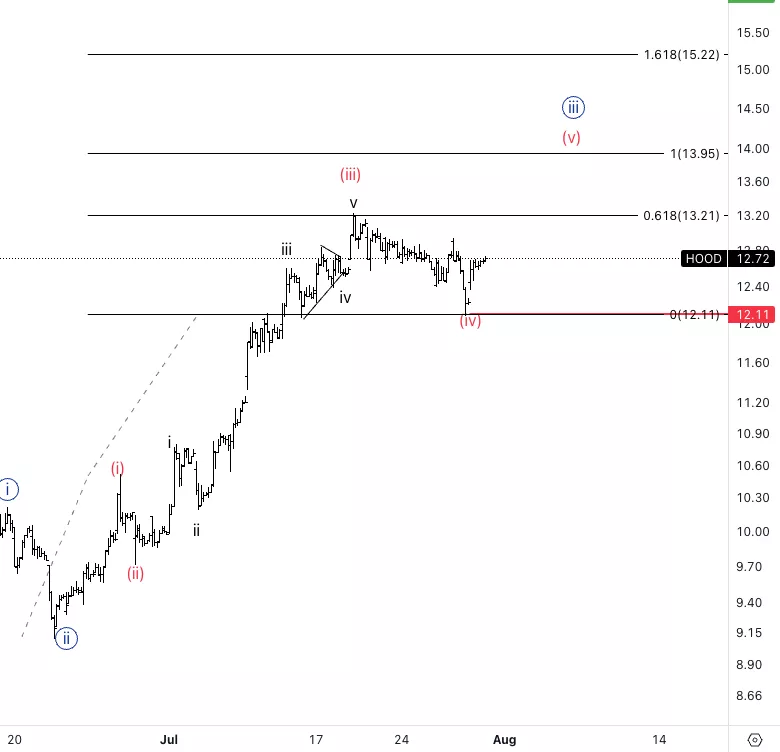
Robinhood Markets Inc., HOOD: 1-hour Chart, Monday, July 31
Robinhood Markets Inc., Elliott Wave Technical Analysis
HOOD Stock Market Analysis: A wave (iv) which looks like a clear three wave move, therefore corrective in nature, and it alternates with a sharp wave (ii). Looking for wave (v) target equality of (i) vs. (v) at 14$.
HOOD Elliott Wave count: Wave i of (v)
HOOD Technical Indicators: 20EMa as support.
HOOD Trading Strategy: Looking for upside into wave (v) with invalidation at 12$.
More By This Author:
Elliott Wave Technical Analysis: Ethereum, Monday, July 31
Nasdaq Stock Market Reports: Elliott Wave Analysis For Tech Stock Trading Opportunities
Elliott Wave Technical Analysis: Monster Beverage Corp. - Friday, July 28


Comments
Log in or sign up to join the conversation.